
Prism Coffee Lab
Everything a green coffee lab sees, on the record.
Intake, grading, photo analysis, sample roasting, blind cupping, reports and analytics, in one record per coffee. On your own server, and still working when the Wi-Fi drops.
One-time payment · no monthly fees · 1 year of updates · sales tax, if any, shown at checkout
How a sample moves
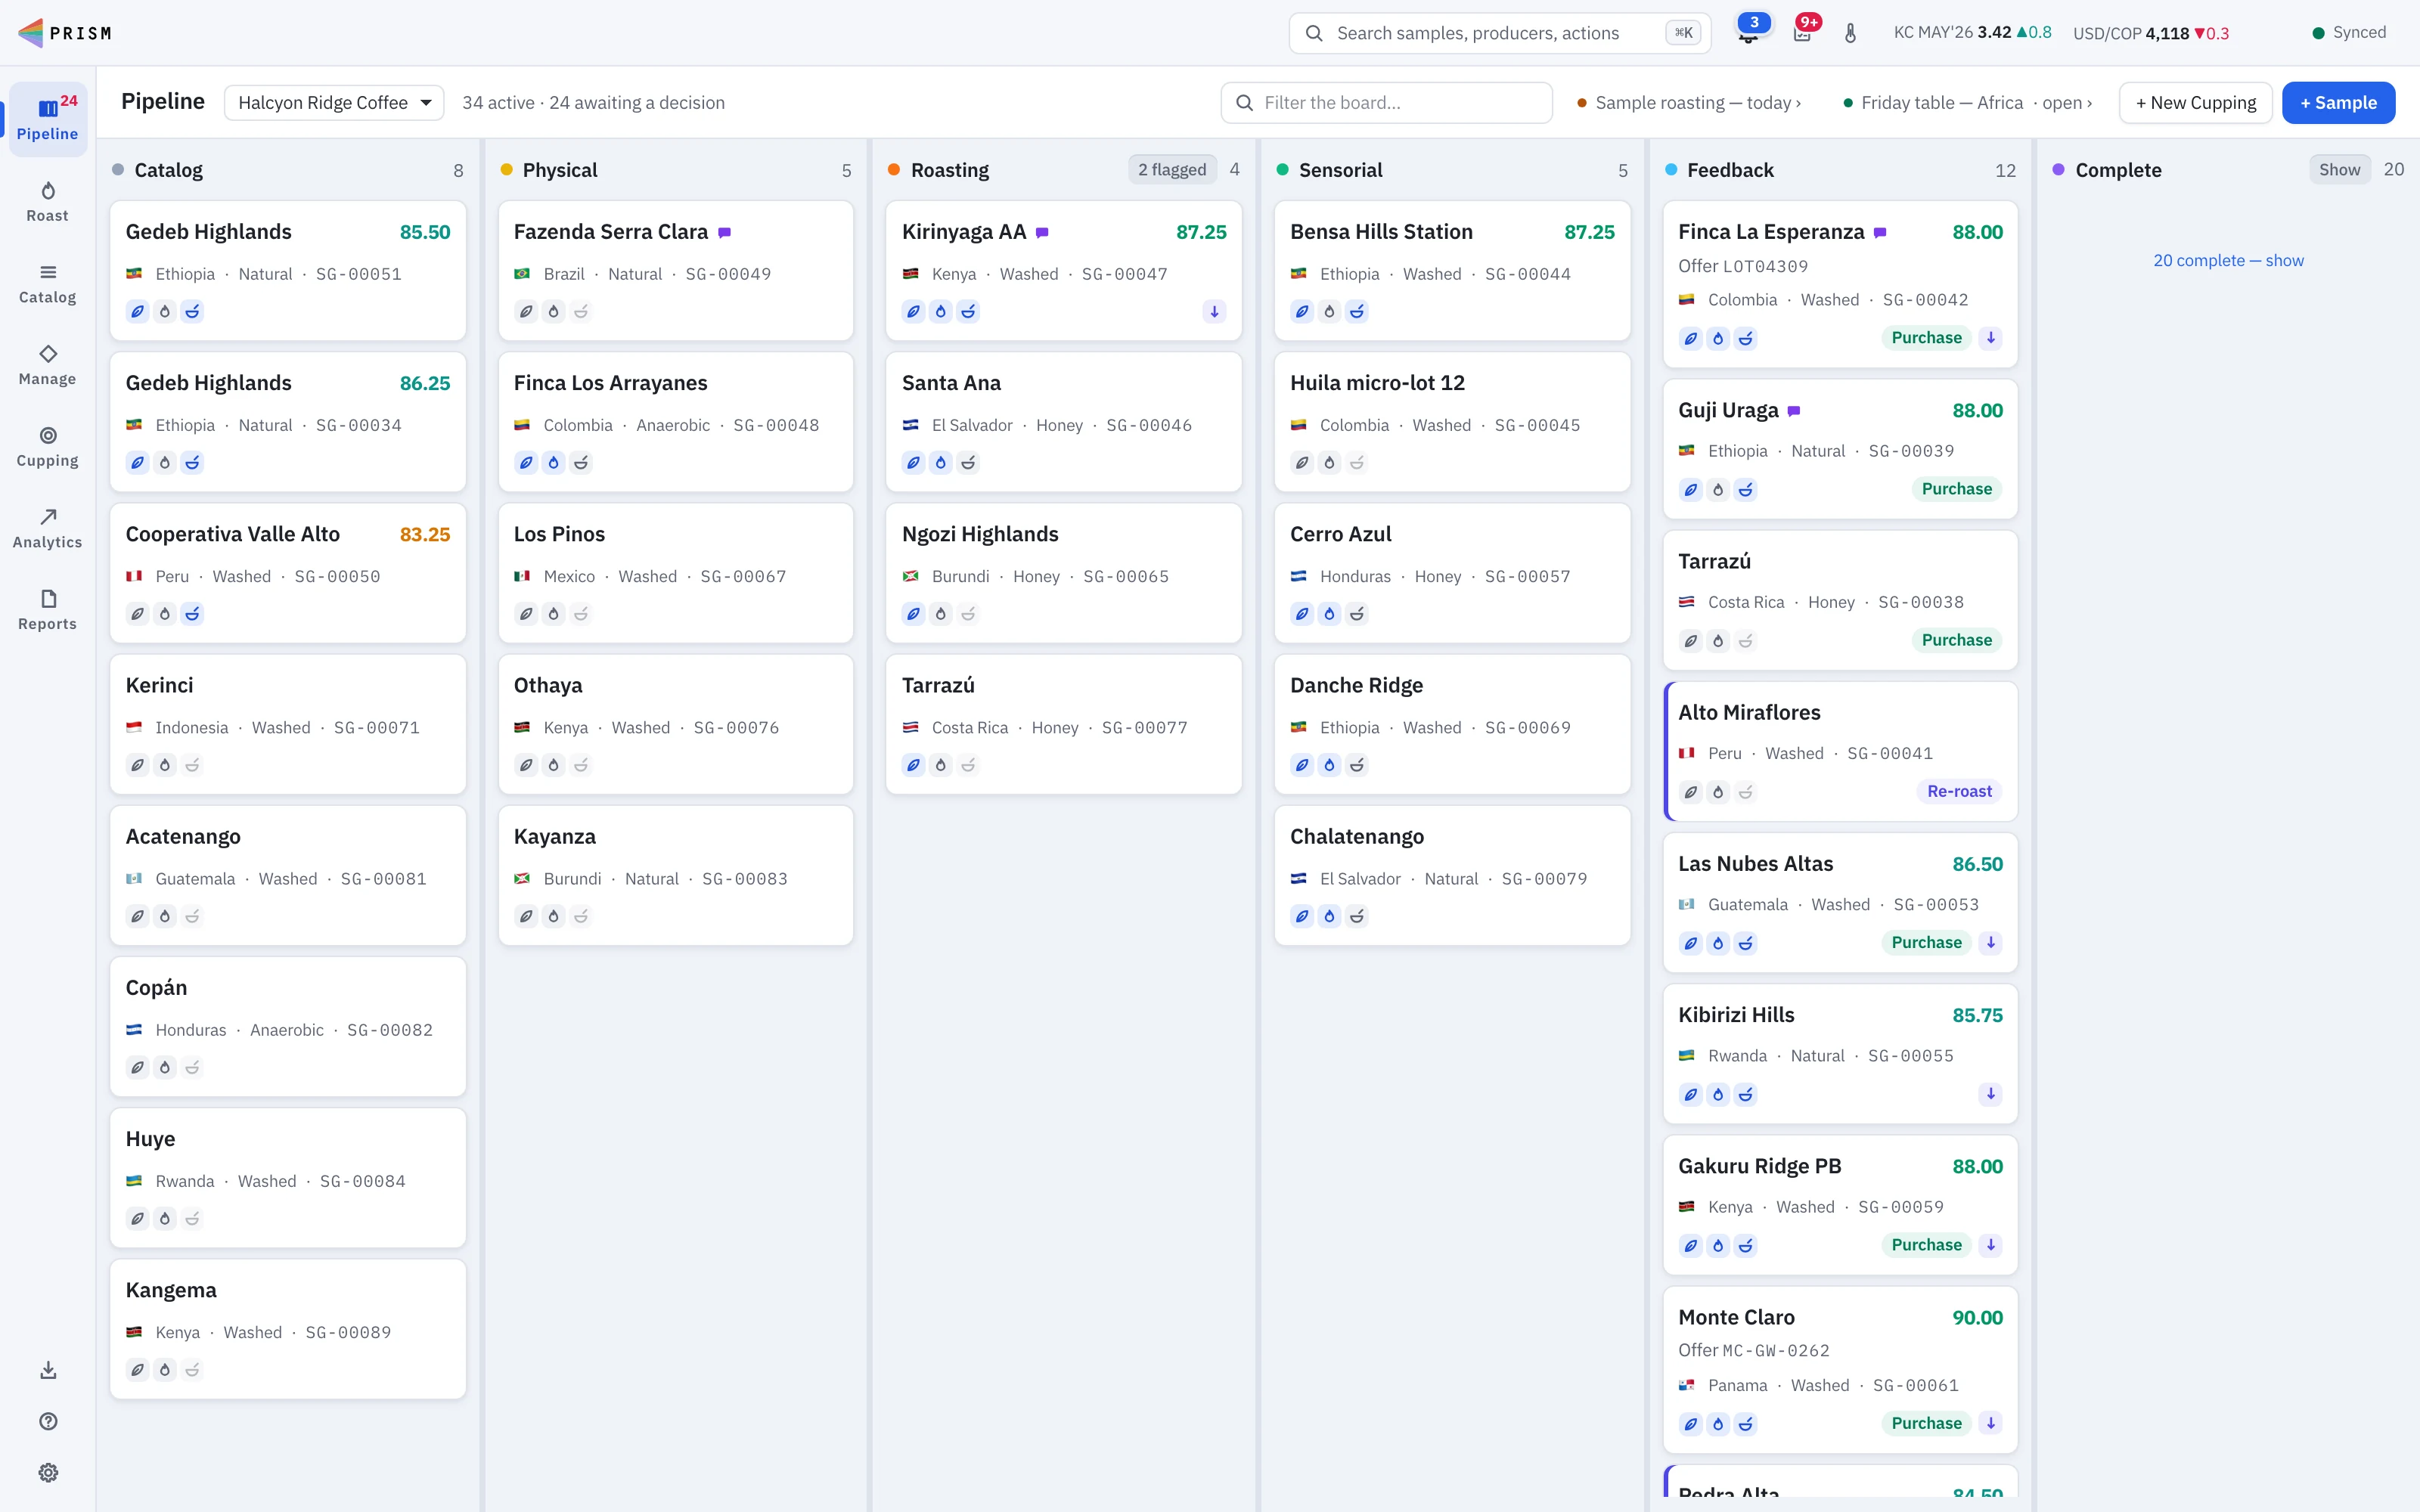
One board, six stages, nothing lost between them
Every sample walks the same path, and most moves happen on their own: a roast moves it to cupping, closing a session moves it to feedback, a decision moves it to complete.
- CatalogRegistered, label printed
- PhysicalGraded against your specs
- RoastingOn today’s roast order
- SensorialOn the cupping table
- FeedbackScores in, decision due
- CompleteApproved, rejected, reported
Intake
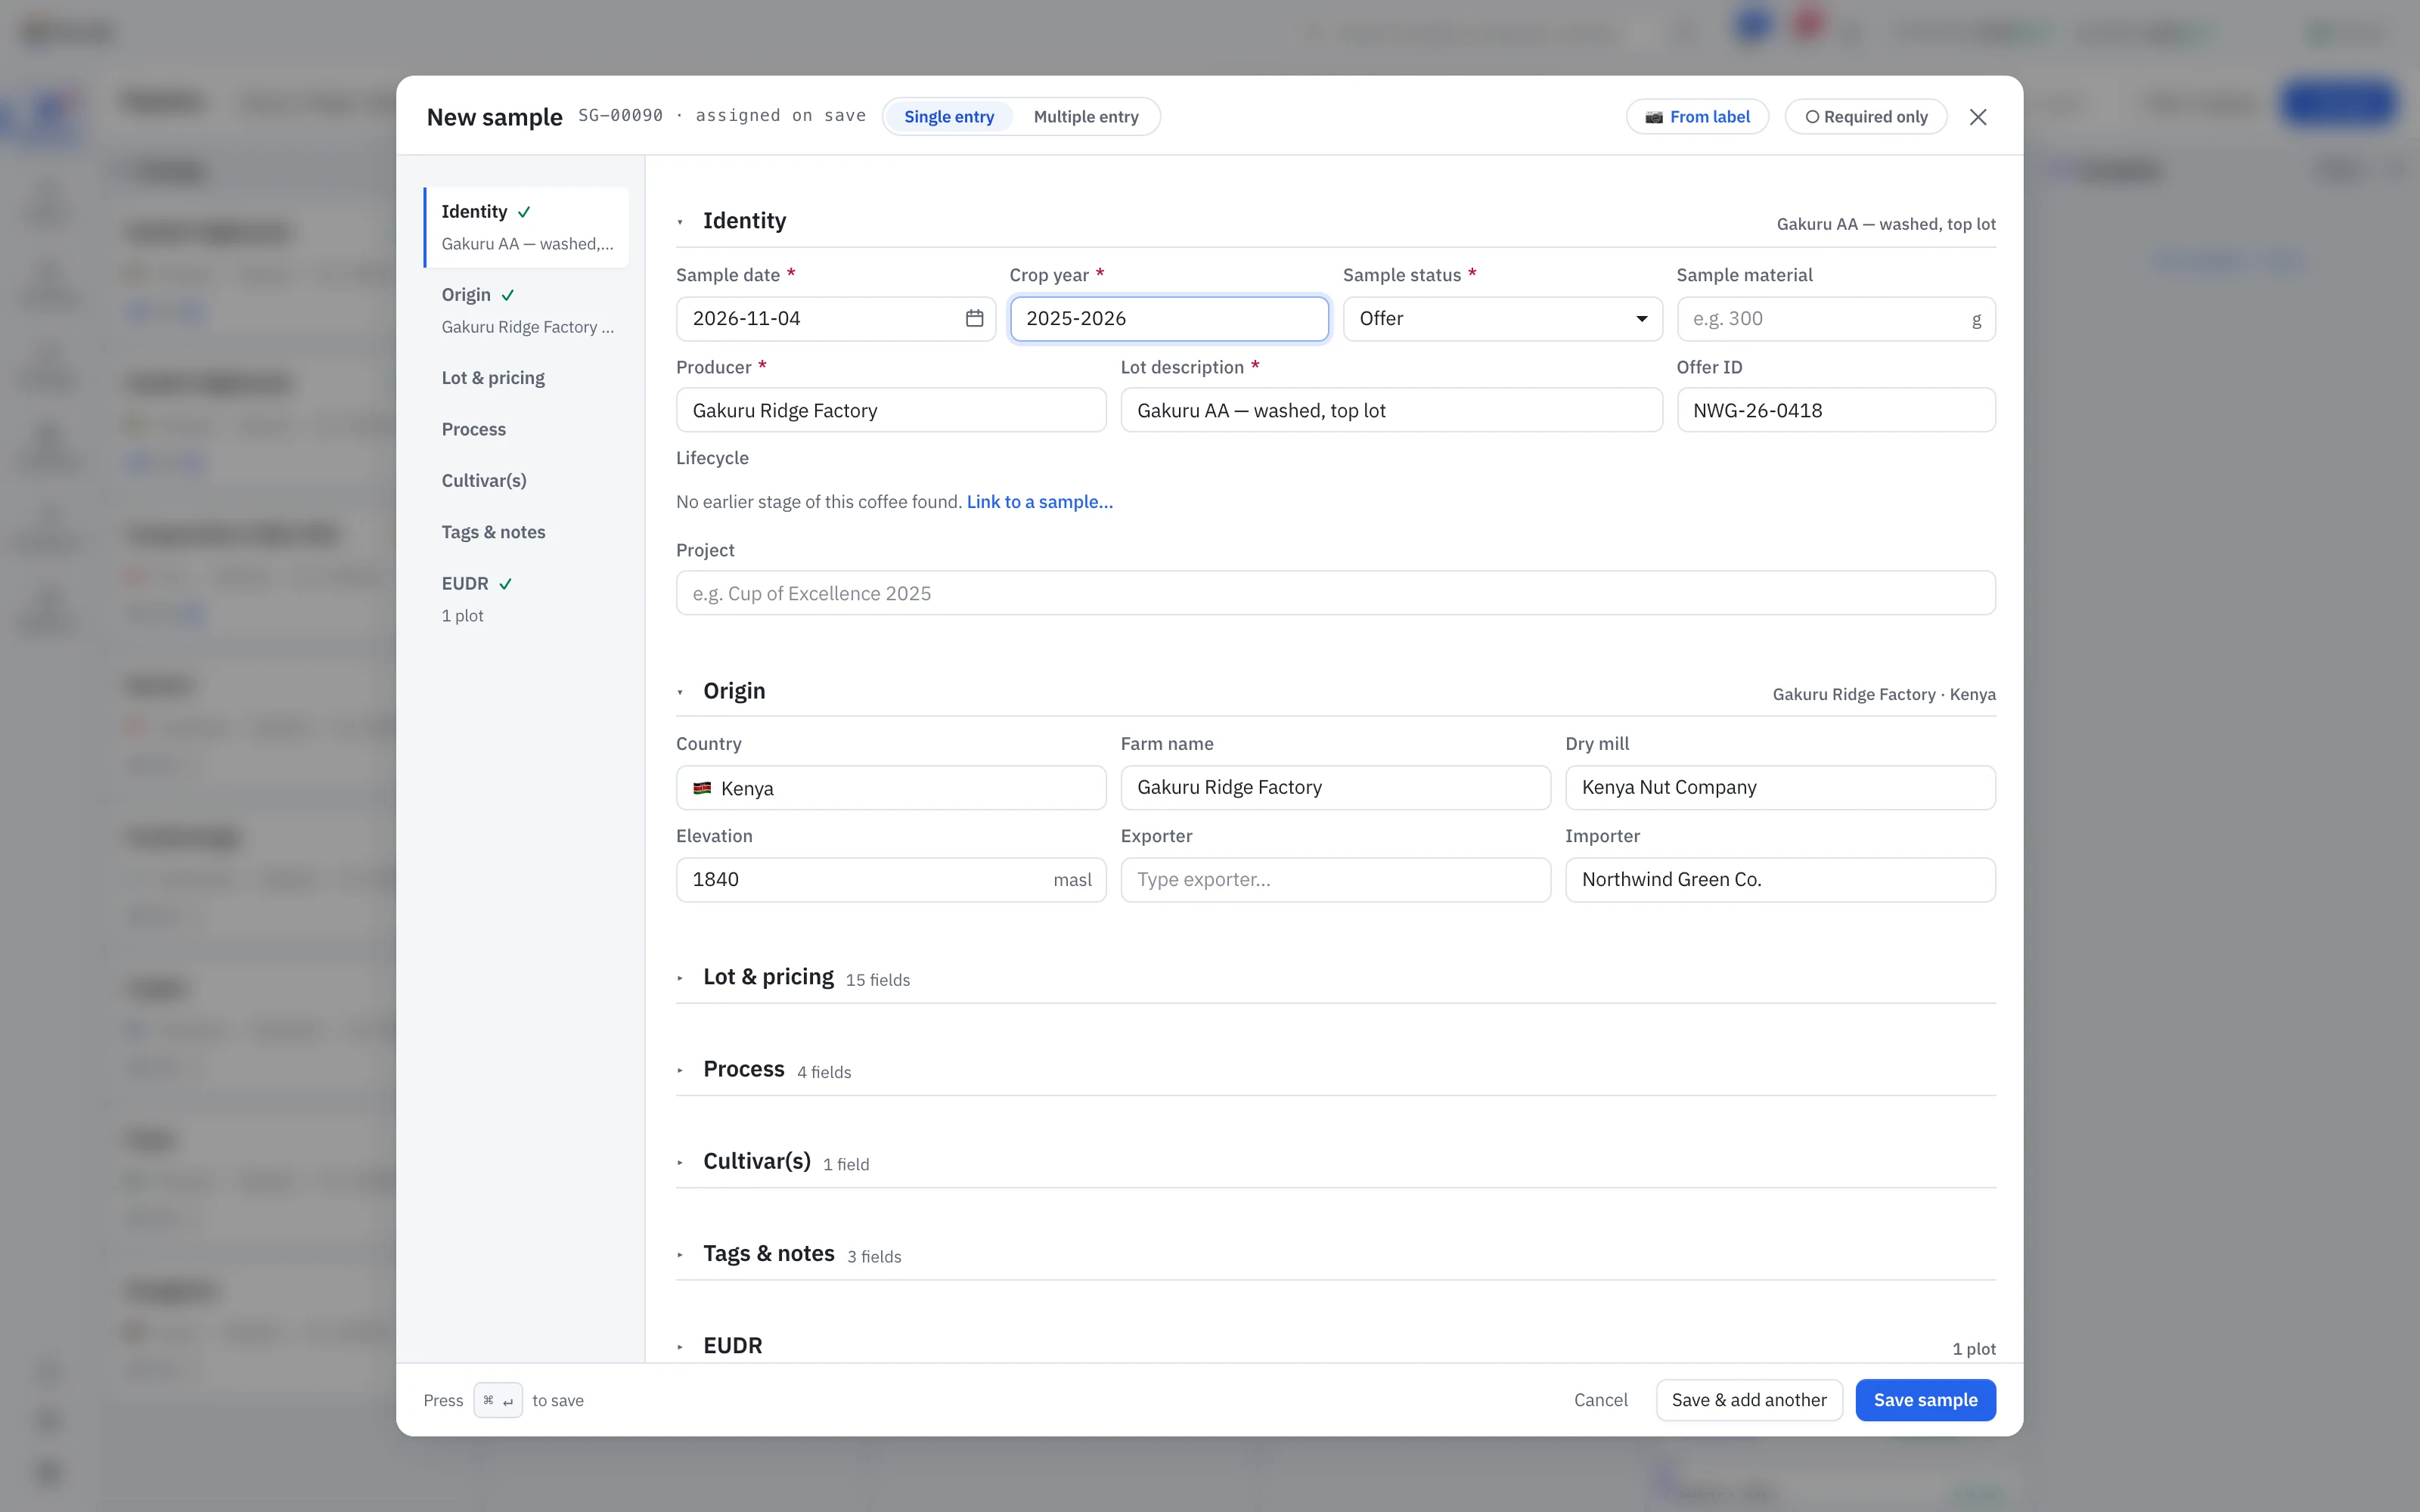
Register one sample, or a whole shipment
Five fields are required; everything else fills in as the paperwork arrives. Paste a block straight from Excel or Google Sheets to register dozens at once, or import a CSV. Producers, farms, exporters, importers and cultivars a row names for the first time are created once.
- Single entry, or a spreadsheet you can paste into
- CSV import for green samples and their evaluations
- Fixed (landed, FOB, farmgate) or floating pricing against the ICE C-market
- Duplicate as template to carry origin and pricing forward
- A barcode label prints on save
Label reading
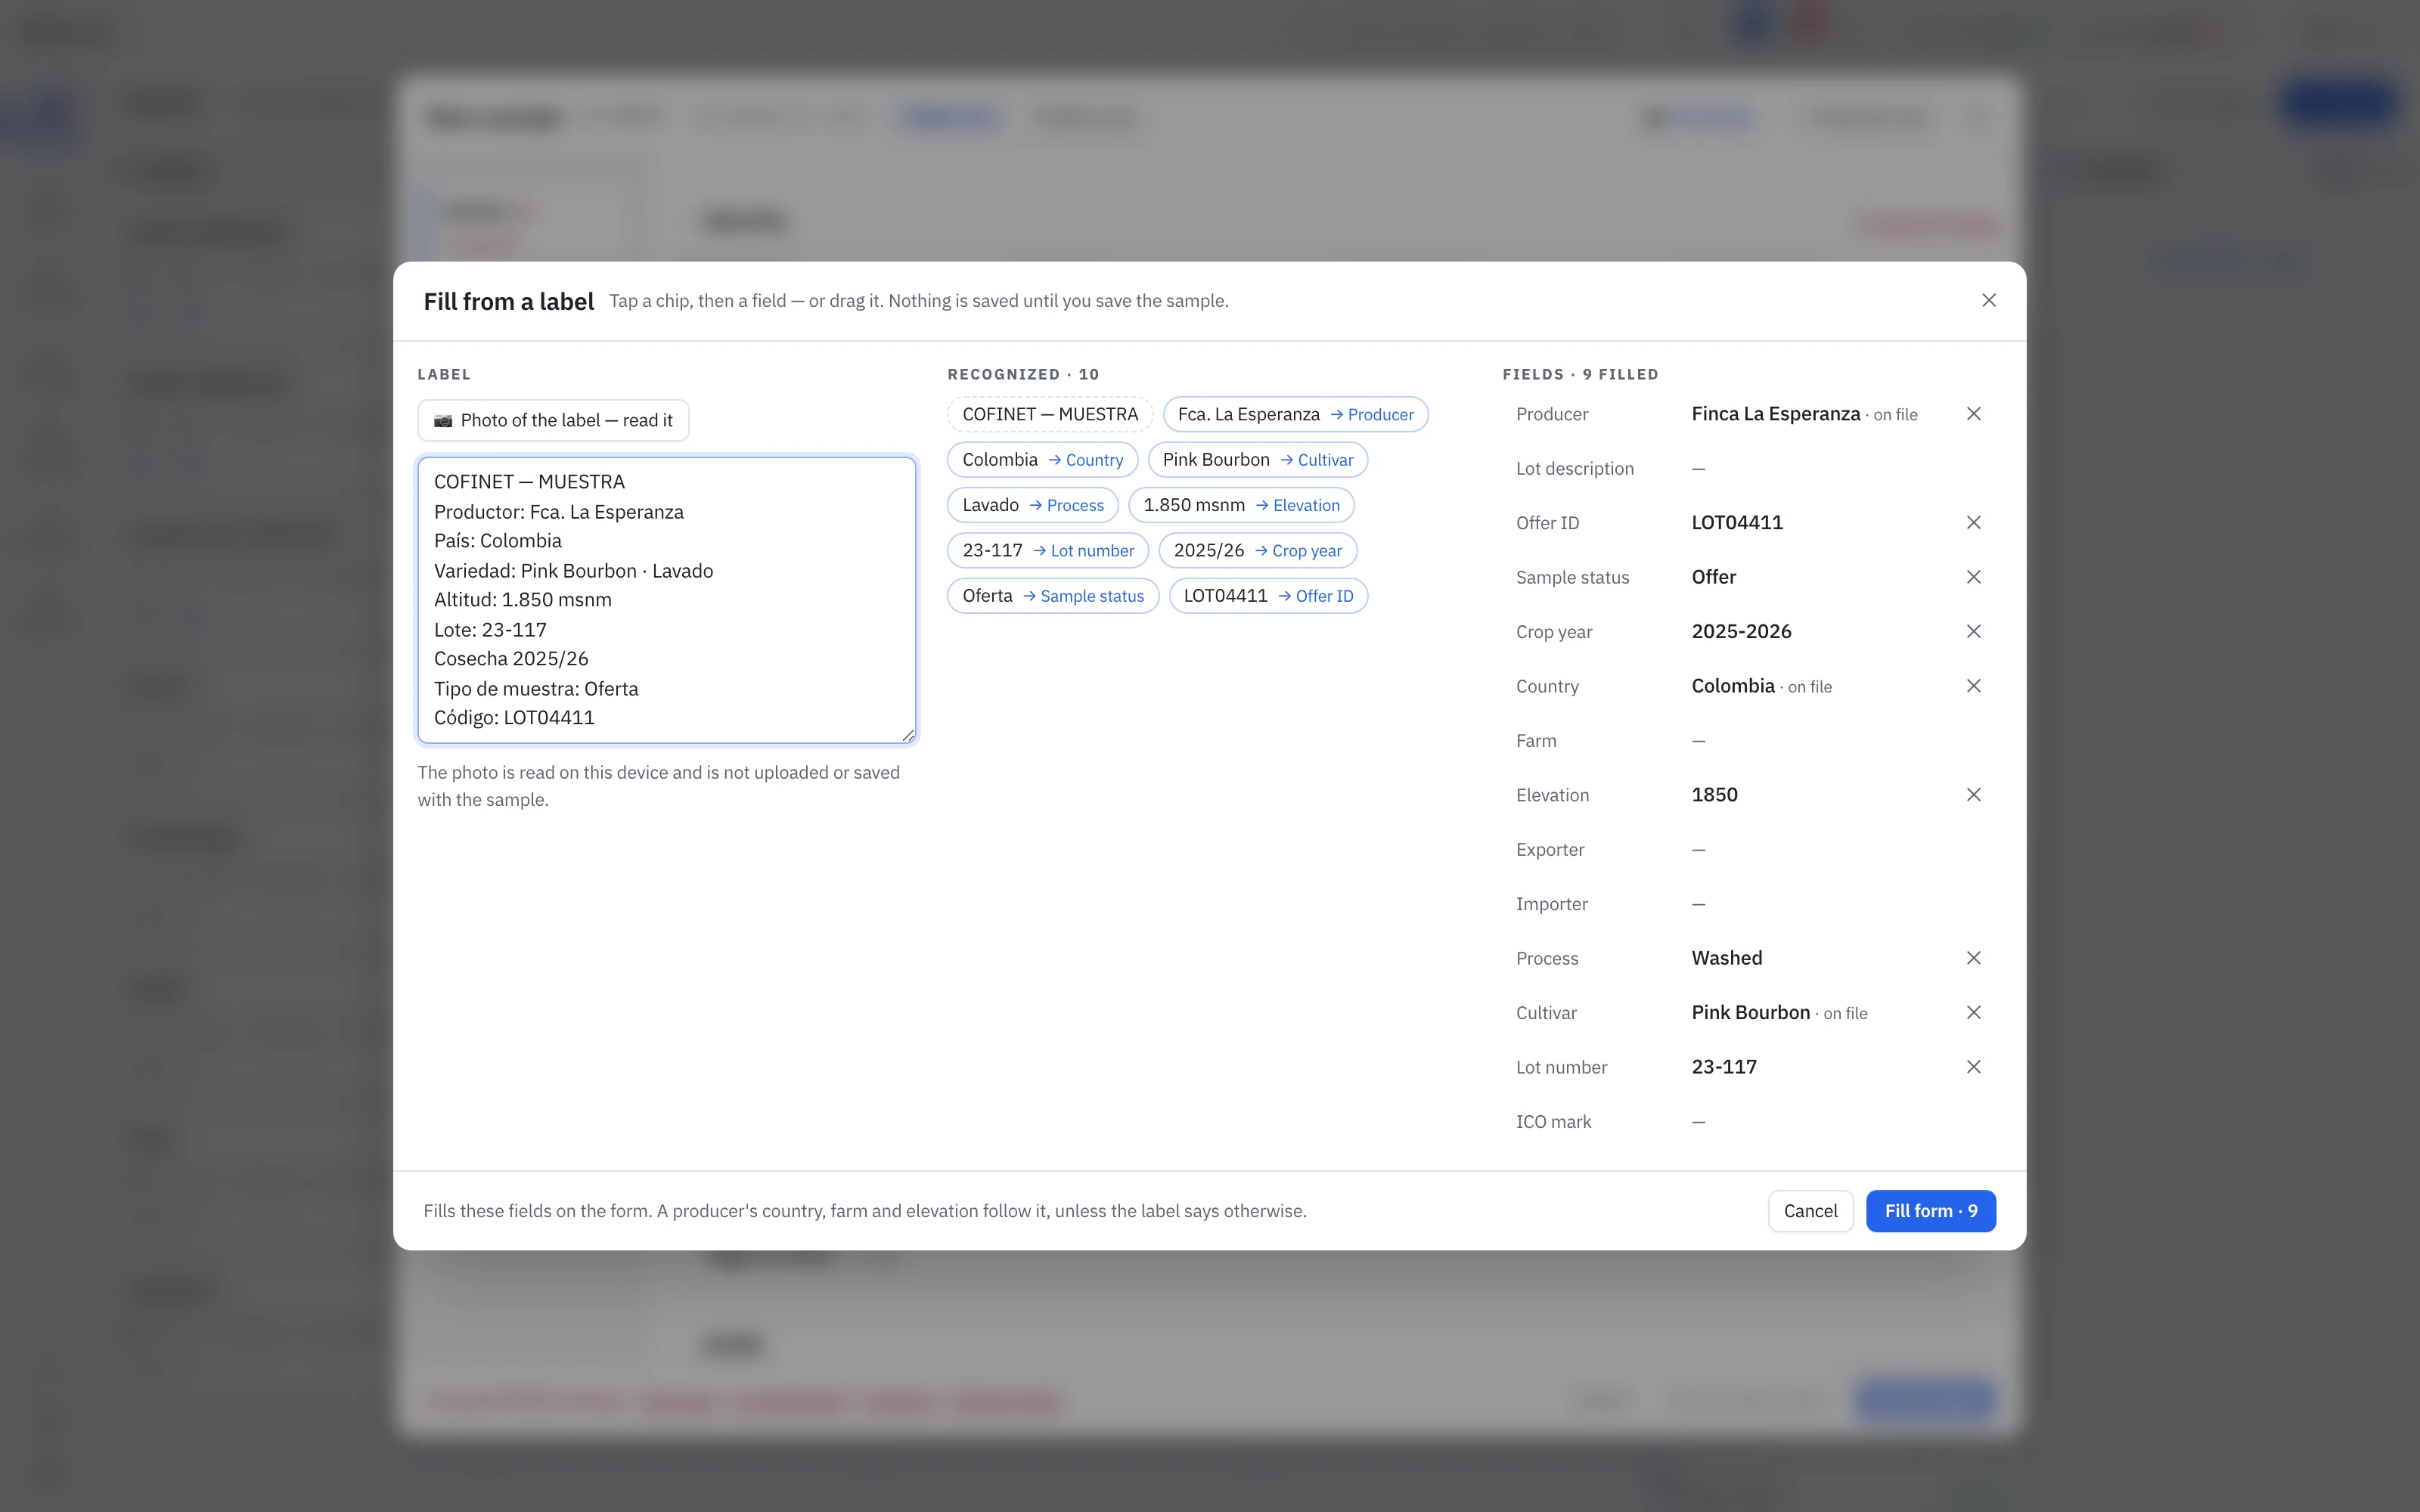
Photograph the label, skip the typing
Take a photo of a sample’s label and Prism reads it on your own device, in English, Spanish or Portuguese. Producer, country, variety, process, altitude, lot and harvest each become a chip you can check, move or drop before anything fills the form. For hard-to-read labels, connect your own Claude account and read the photo with Claude Vision instead.
- Labels read on your own device; the photo isn’t uploaded
- English, Spanish and Portuguese labels
- Every reading shown as a chip before it fills a field
- Producers already on file matched, with their country, farm and elevation
- Optional Claude Vision for hard-to-read labels, with your own API key
The pipeline
A board that tells you what is waiting
Each card leads with the coffee’s name and score, shows at a glance whether it has been graded, roasted and cupped, and opens any of them in one click. Its verdict sits beside them. A card gets a colored edge only when it needs you: purple for a re-roast, amber with a day count for a sample that has stalled, so nothing past the 48-hour freshness window goes unnoticed.
- Catalog, Physical, Roasting, Sensorial, Feedback, Complete
- Drag a card, or select a whole column and act on all of it
- Filter by lot, producer, number, offer or process
- Stalled cards flagged after 7 days, or 2 days off roast
- Purchase, Re-roast or Decline on the card; a re-roast goes back to Roasting
- Every bulk move undoable in one step
The sample record
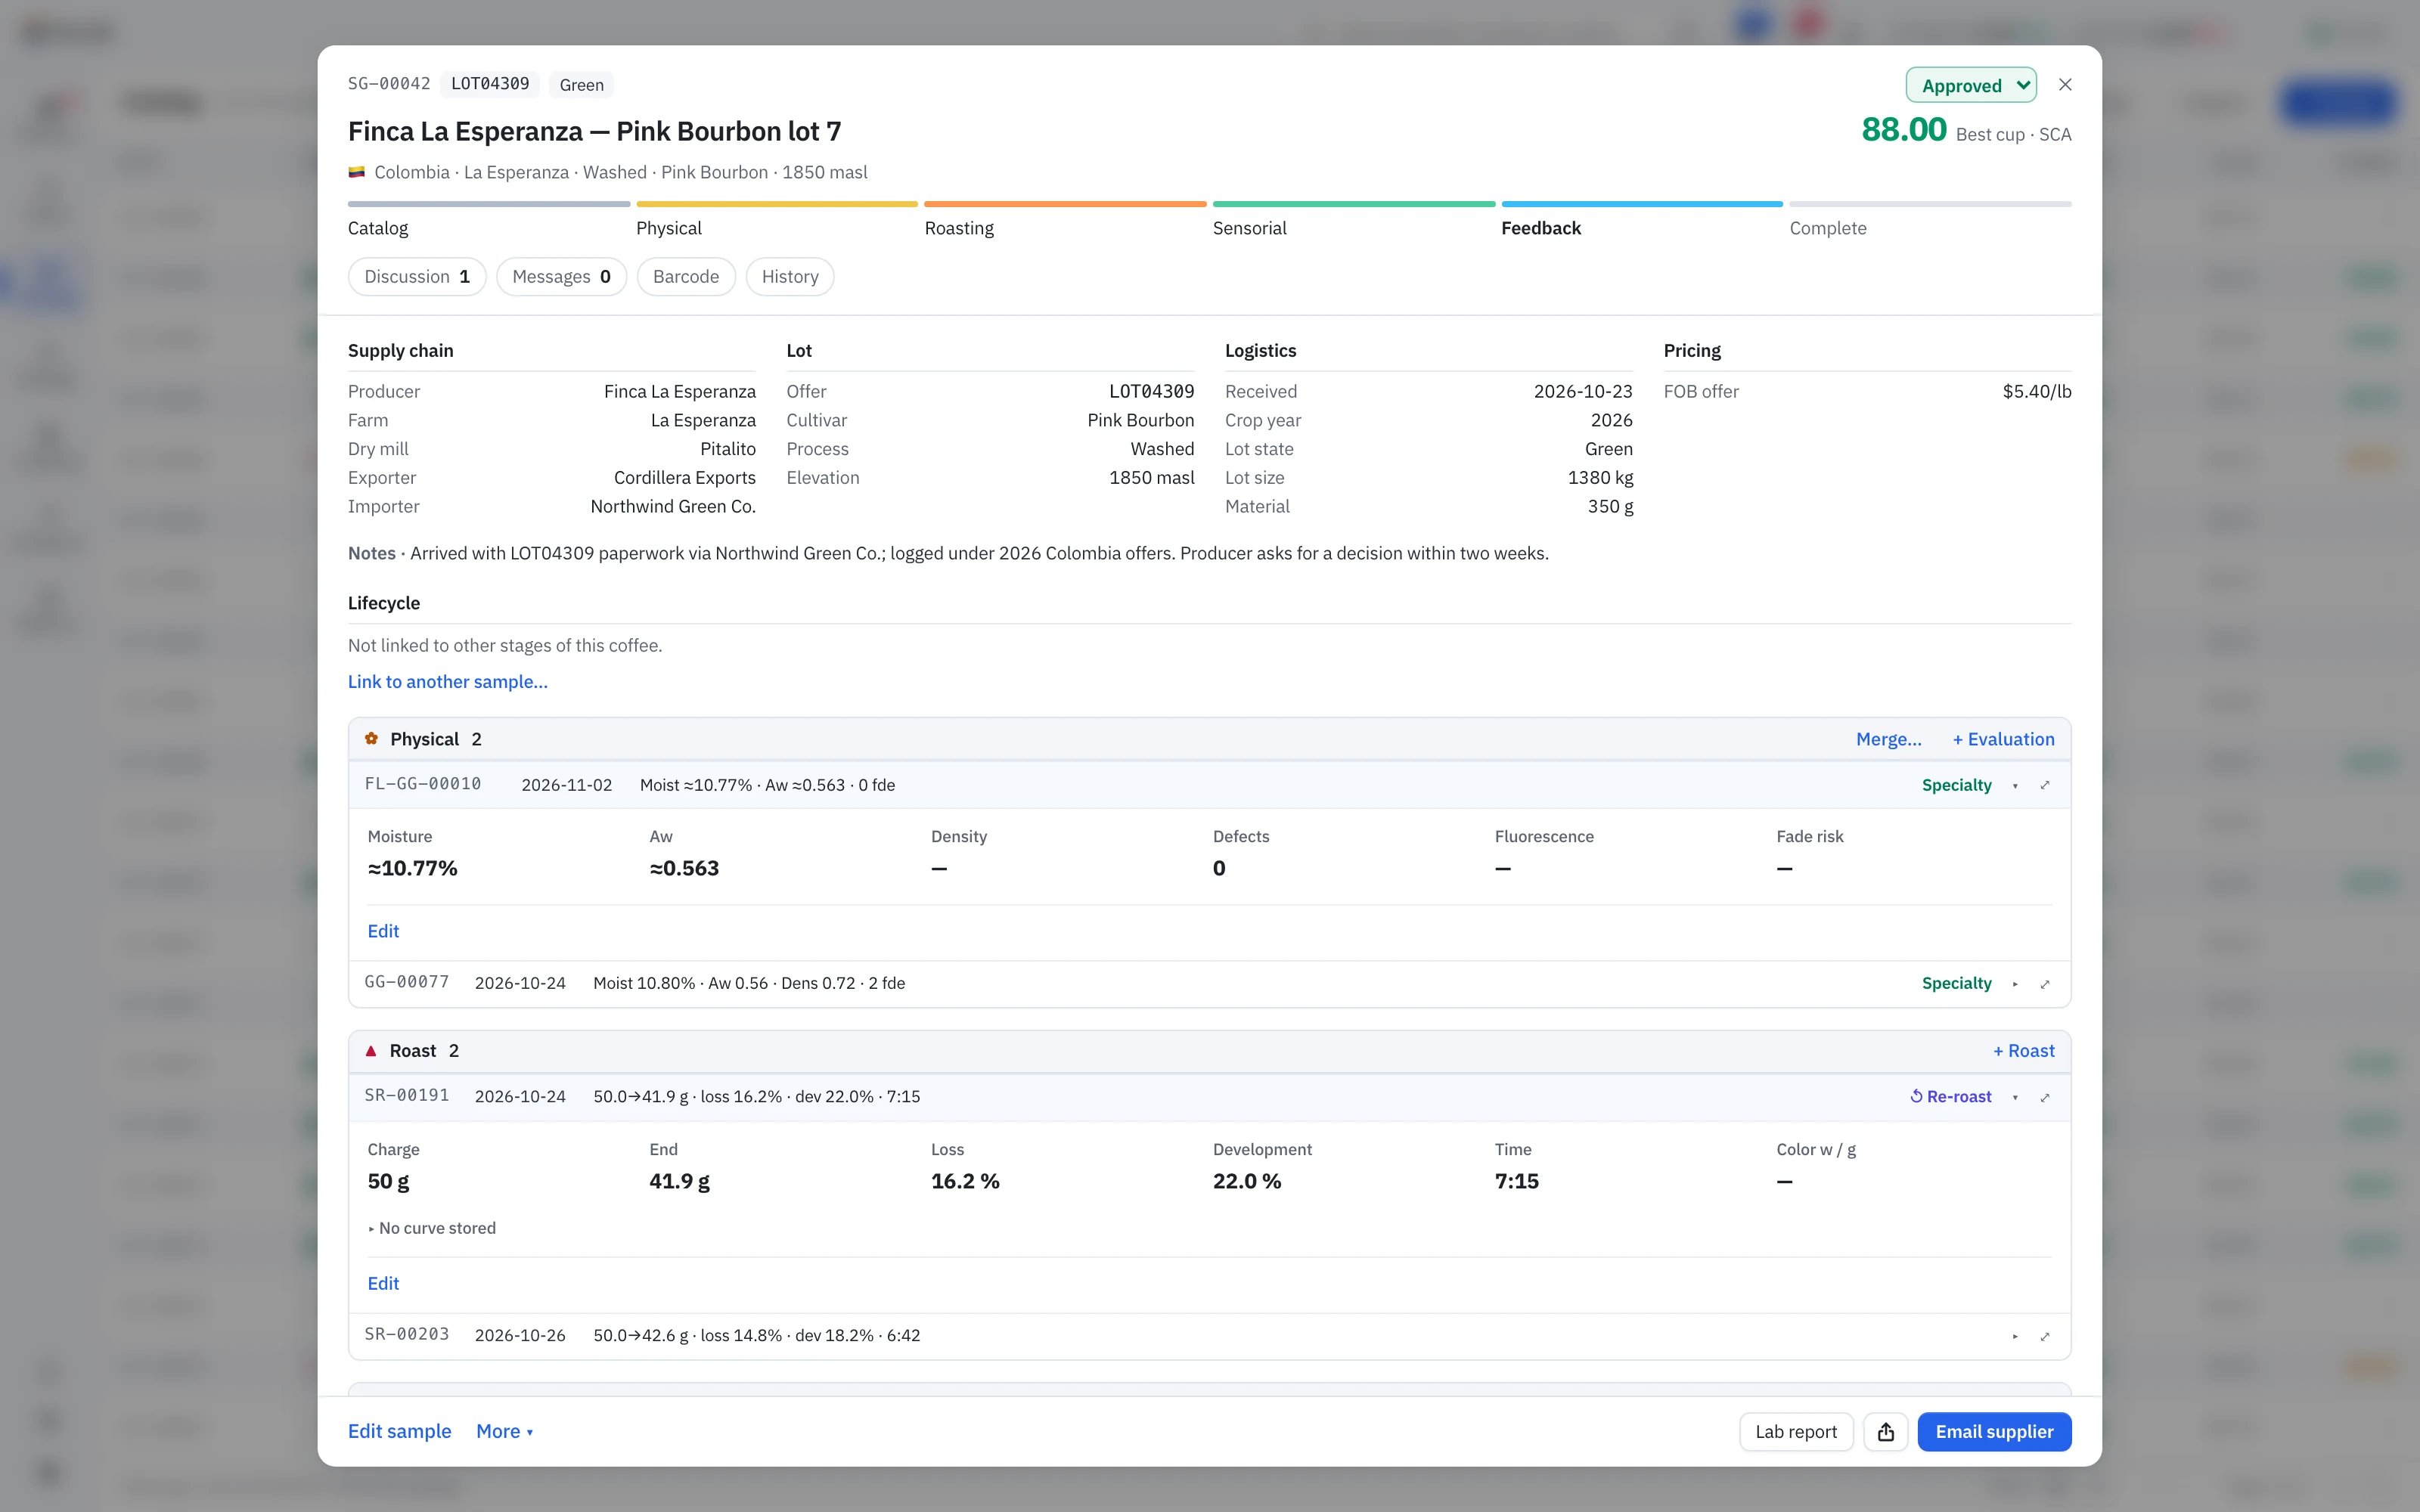
Every measurement on one sheet
Open a sample from the catalog and its record slides in beside the list, so you can read one coffee against its neighbors. Expand it to the full sheet to work: every evaluation editable where it sits, the discussion, the supplier correspondence, the barcode and the full history down the side.
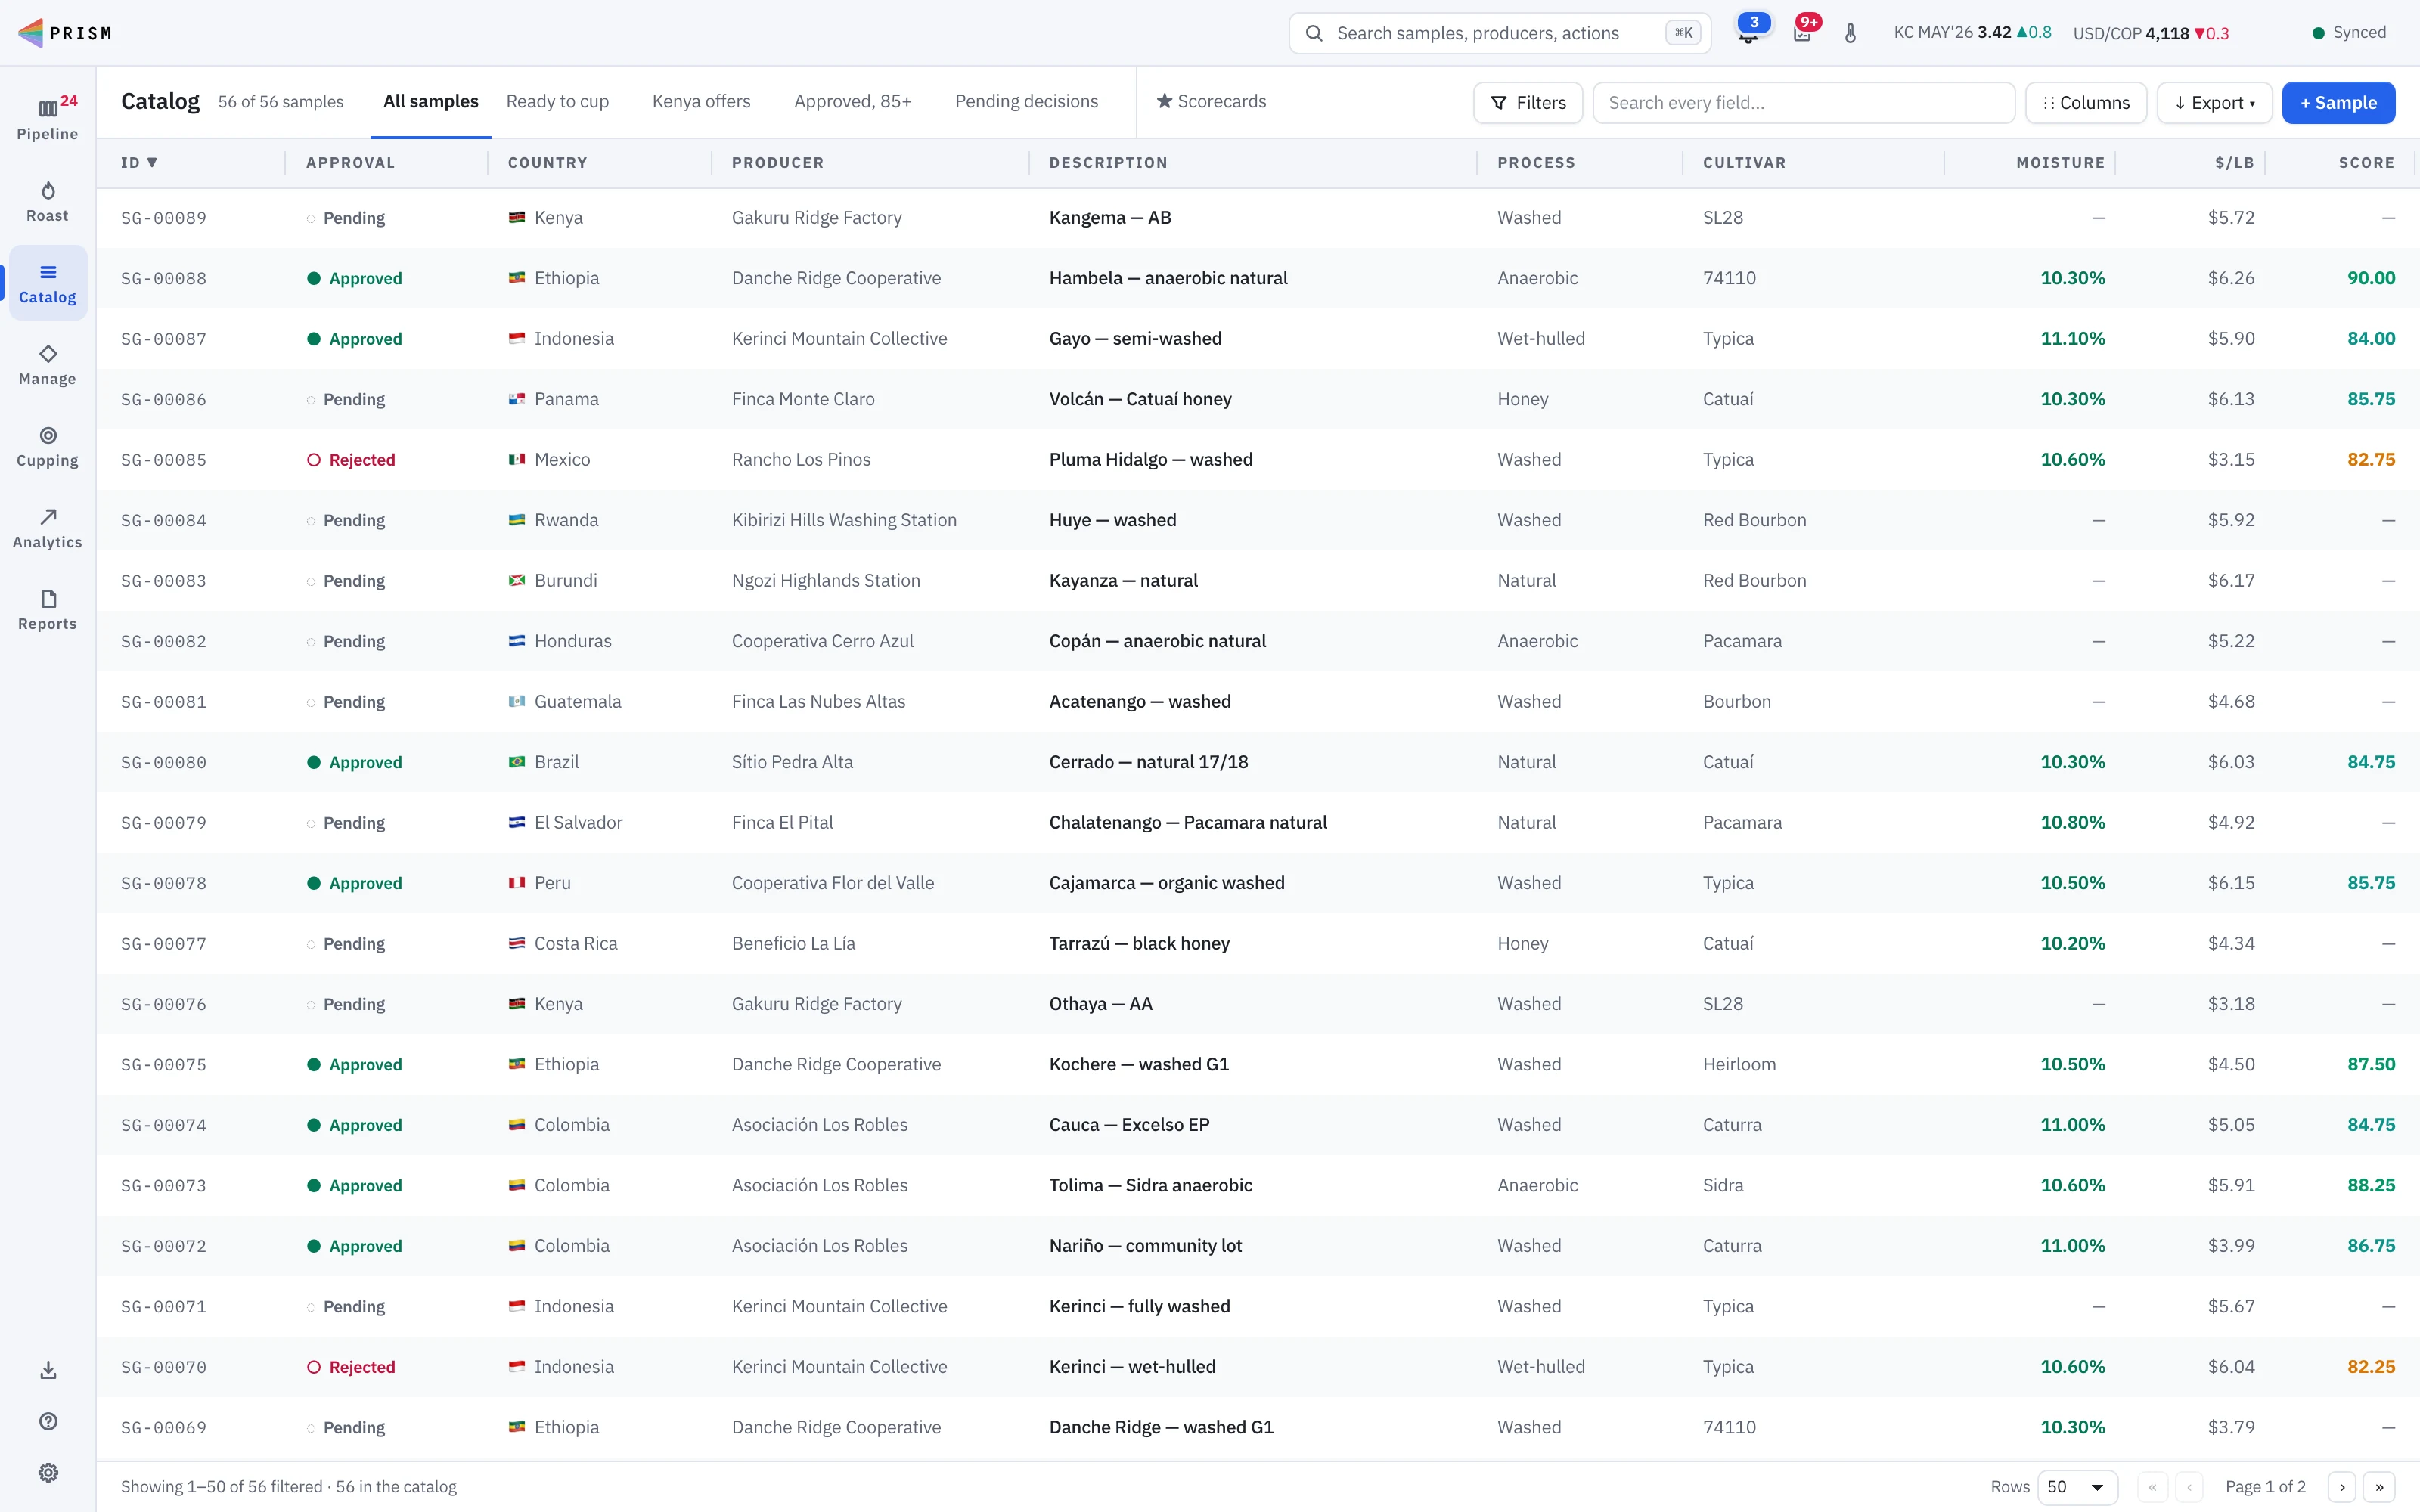
- Search every field: producer, importer, farm, ICO, flavor notes
- Saved catalog views with their filters, sort and columns
- Discussion and supplier email on the record
- Stage, commercial status and approval kept apart
- A command palette (⌘K) that finds anything
Saved views
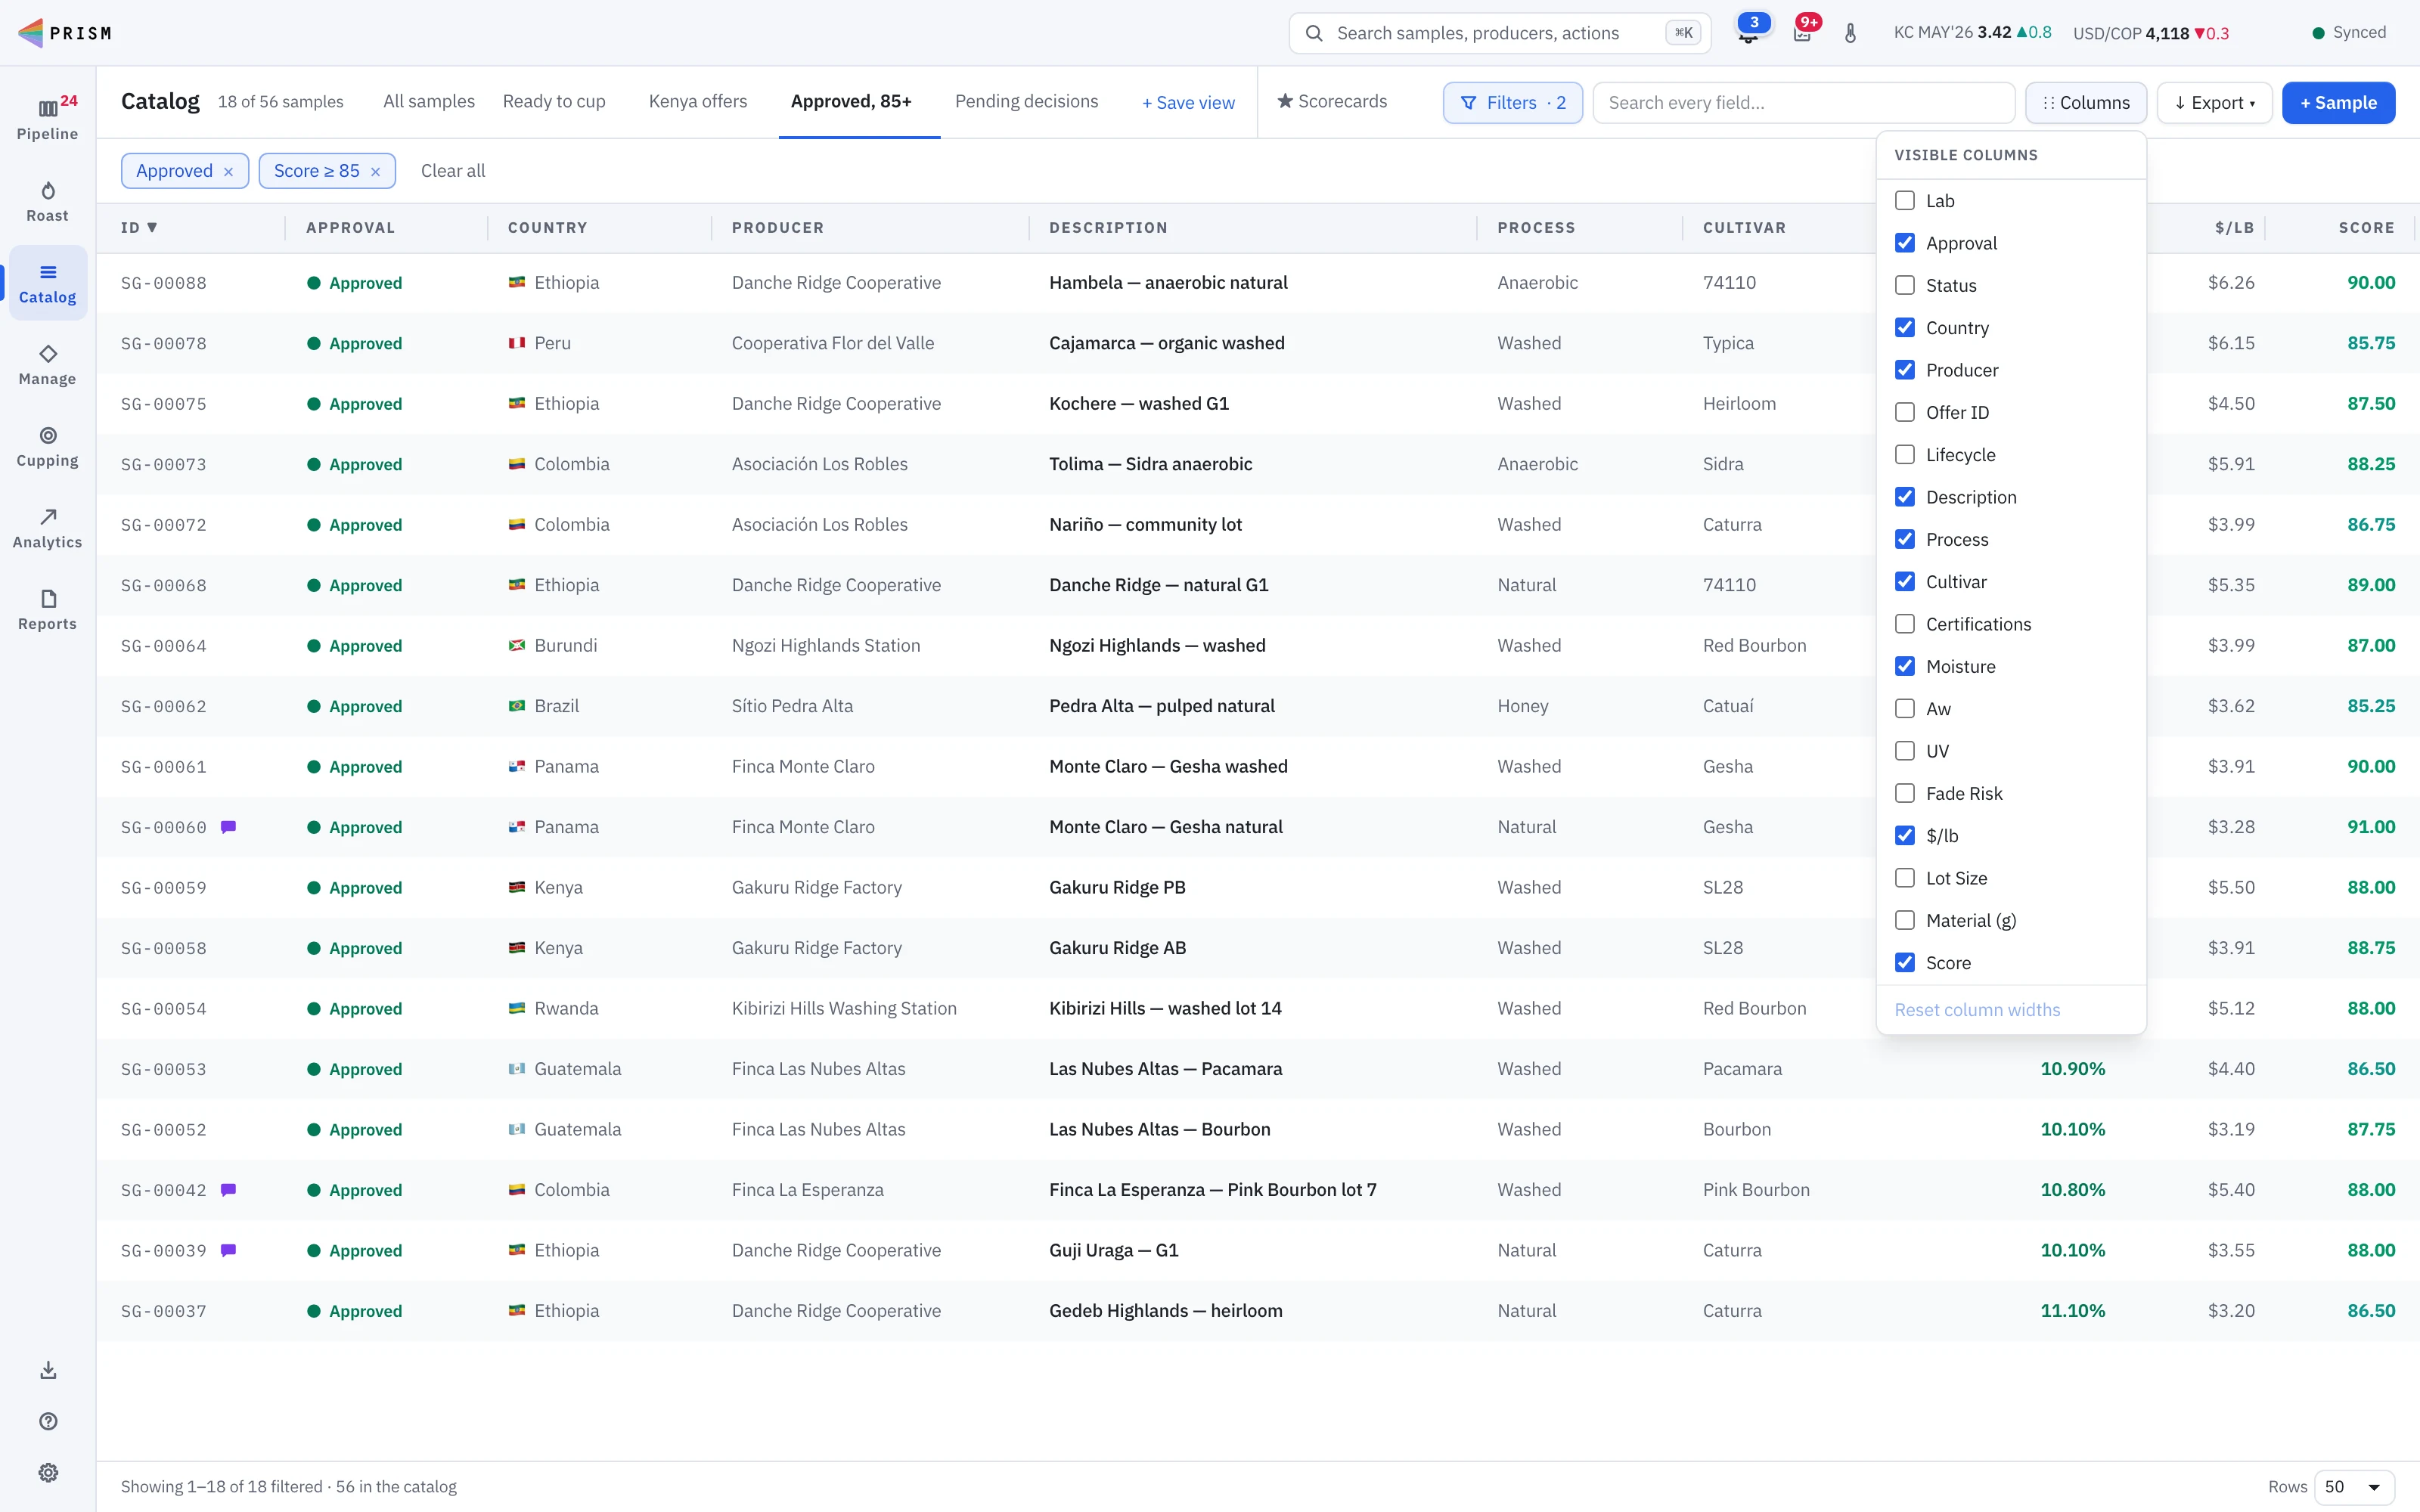
A catalog that remembers how you look at it
Set the filters, the sort and the columns once, and save them as a tab beside All samples: the offers still to cup, one origin’s arrivals, everything under your price ceiling. A click brings the whole view back, and changes save into it.
- Filters, sort and columns saved together as a tab
- One click to switch between views
- Update a view in place, or delete it with an undo
- Hide columns for today’s reading; exports always carry the full record
Physical evaluation
SCA green grading, counted like a grader counts
Count primary and secondary defects in real-time with Prism capturing the full defect equivalents. Photograph your grading mat for sharing with suppliers to close information gaps.
- Category 1 and 2 defects with live full-defect conversion
- Moisture, water activity, density and electrical conductivity
- Screen analysis from your sieves, plus a photo estimate beside it
- Green, UV, defect and screen photos on the record
- A fade-risk call with the evidence and a suggested band beside it
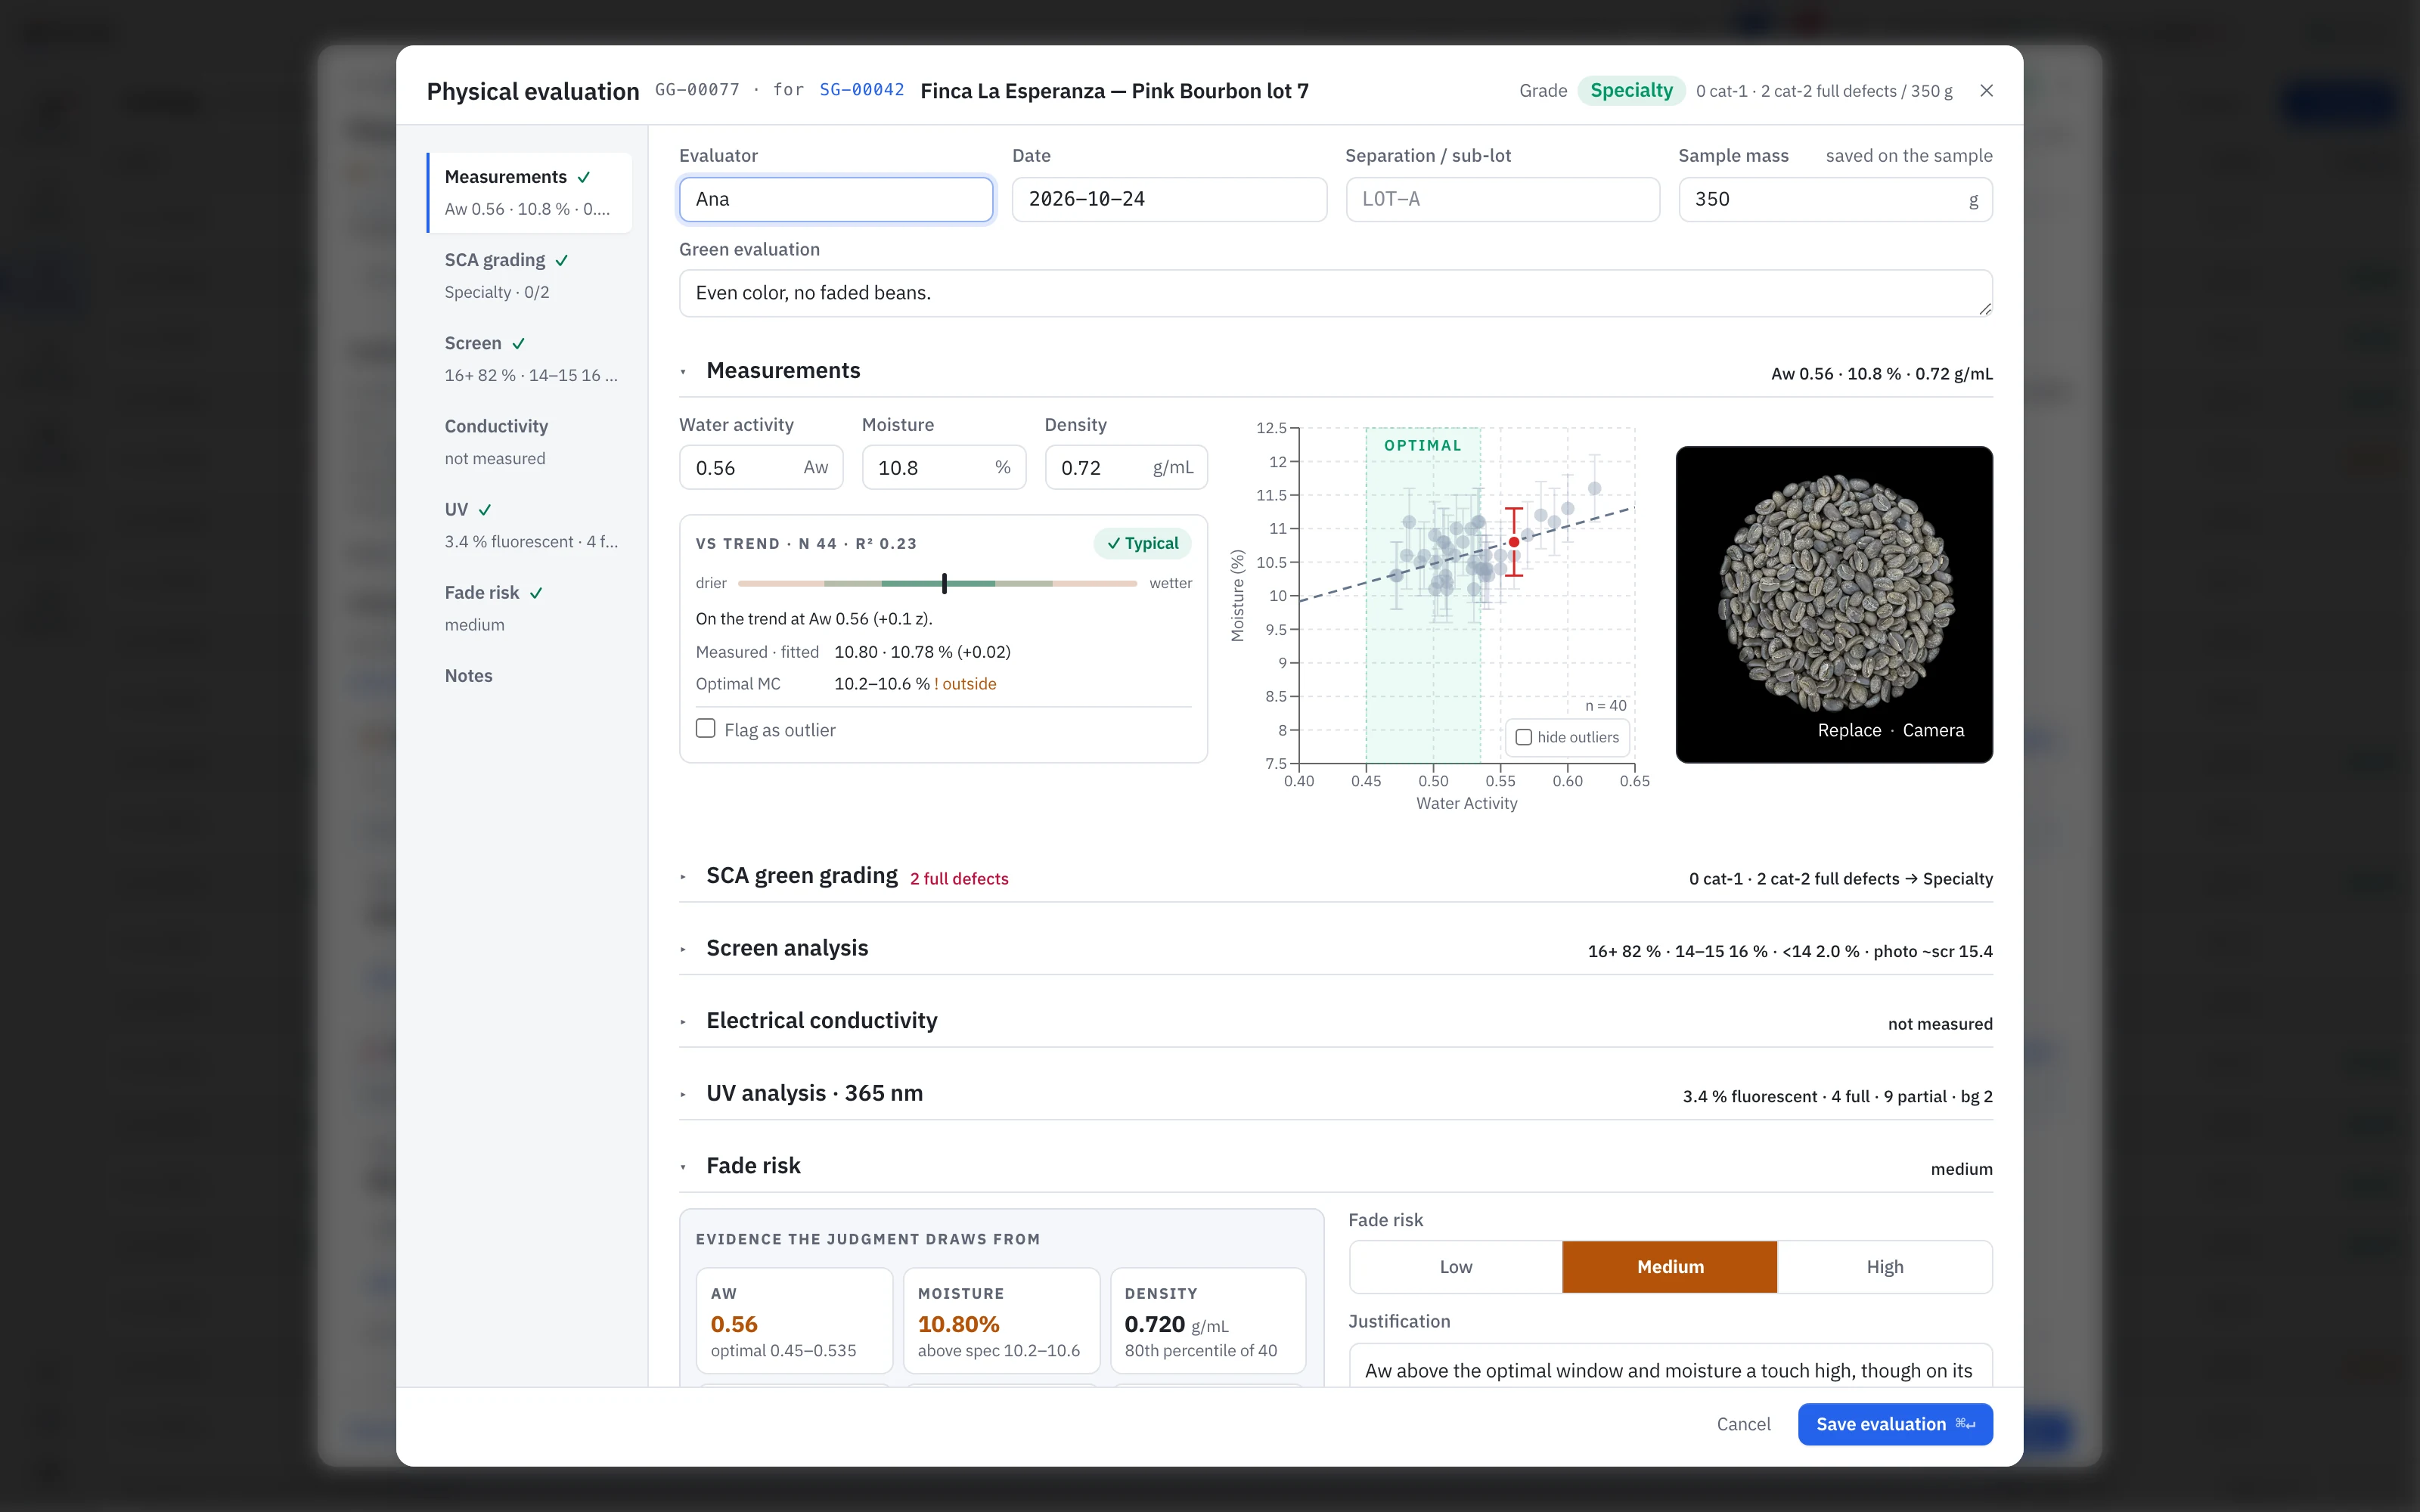
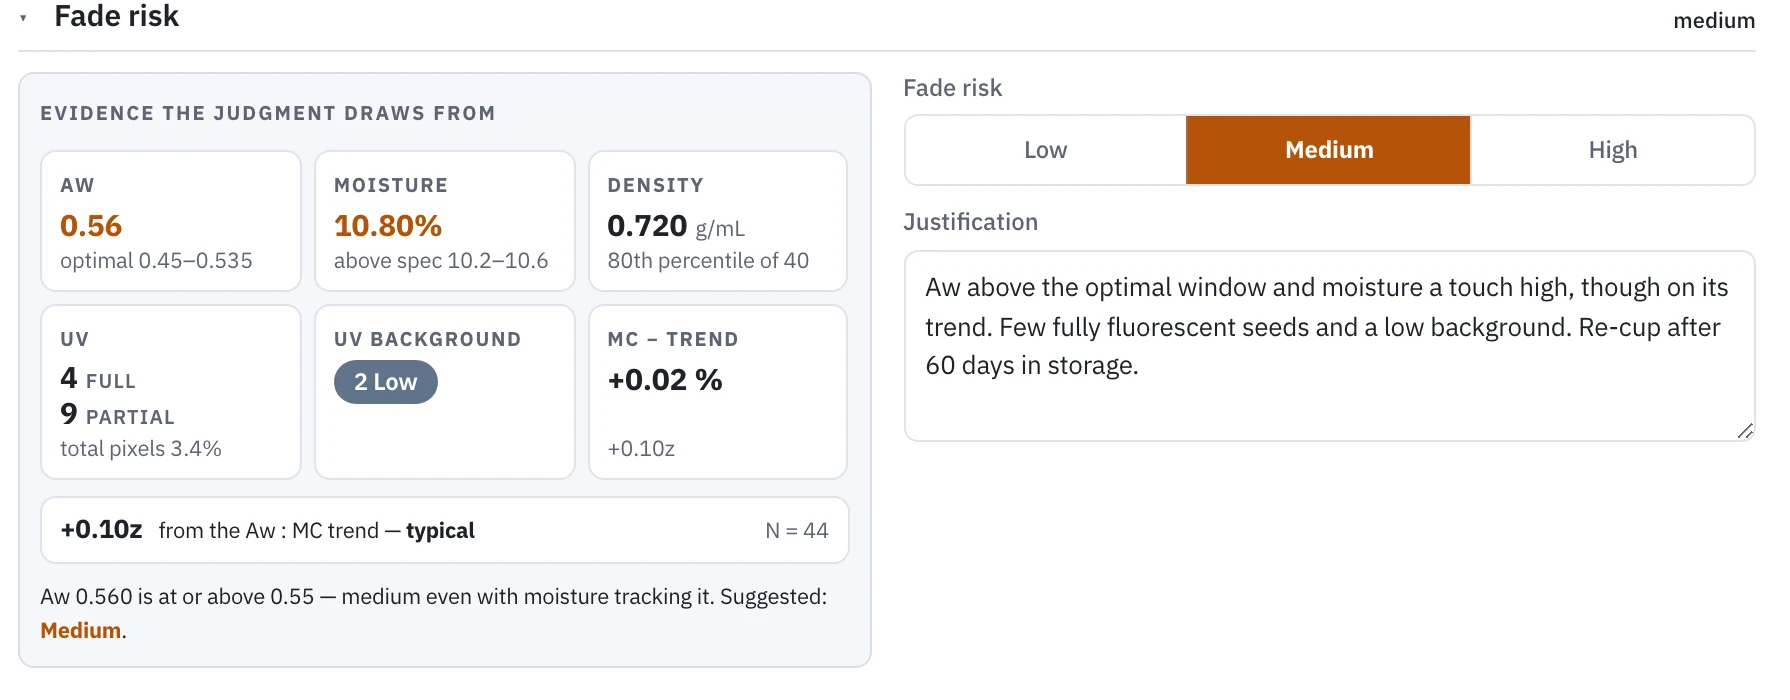
Fade risk, argued from the evidence: water activity, moisture, density ranked against your own coffees, UV seed counts and background fluorescence sit beside the call. Prism suggests a band and says why; the verdict stays yours.
Verdicts in words
Every reading is In spec, Below spec, Watch or Out: color is never the only signal, on screen or on paper.
Specs from your own coffees
The moisture window is derived from your water-activity window through your own population’s fit, so it follows whatever meter you use.
Your meters, on the record
Name your instruments and each point carries its real precision, with the ISO calibration basis printed on the report.
Photo analysis
UV fluorescence and screen size, measured from photographs
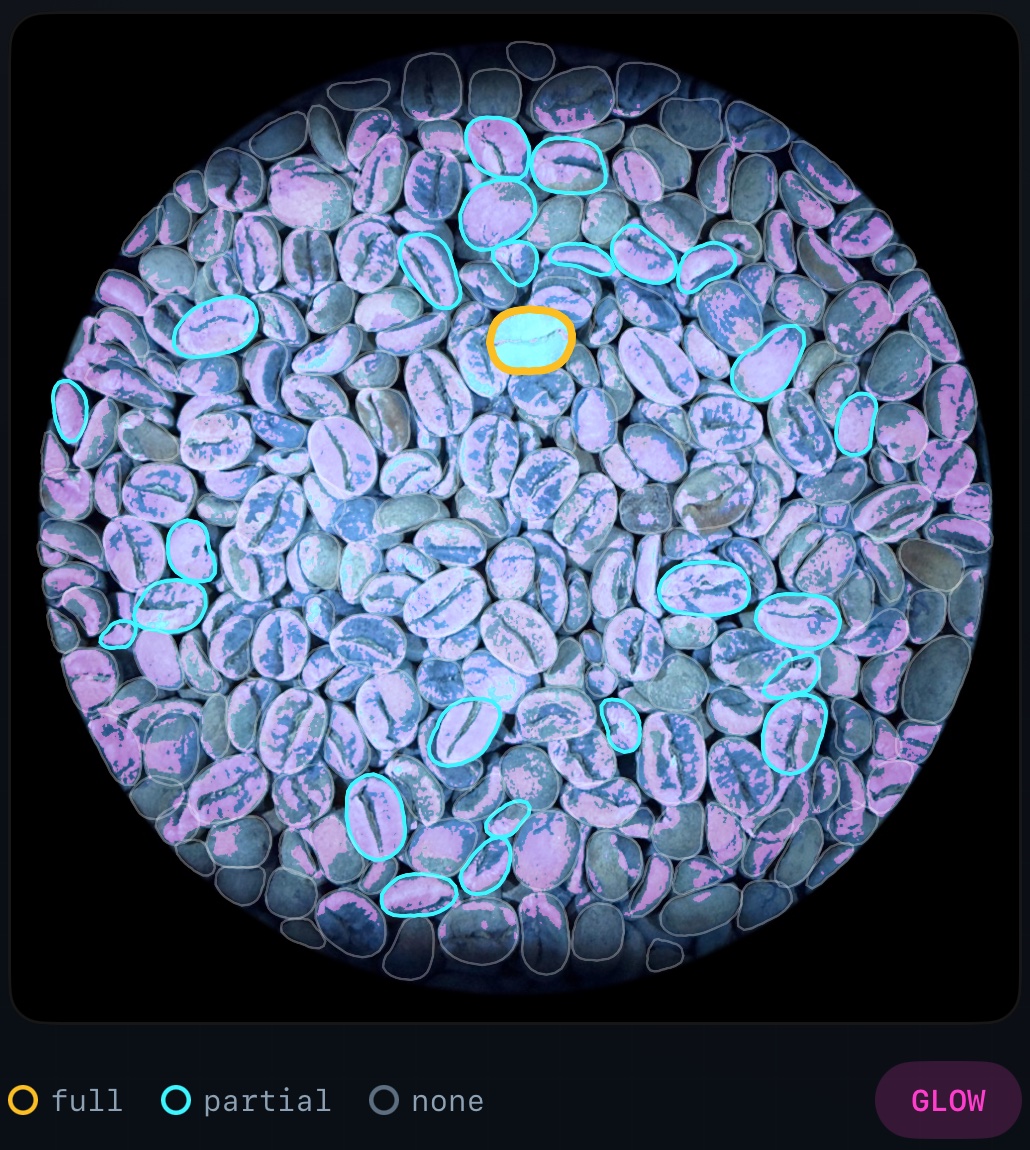
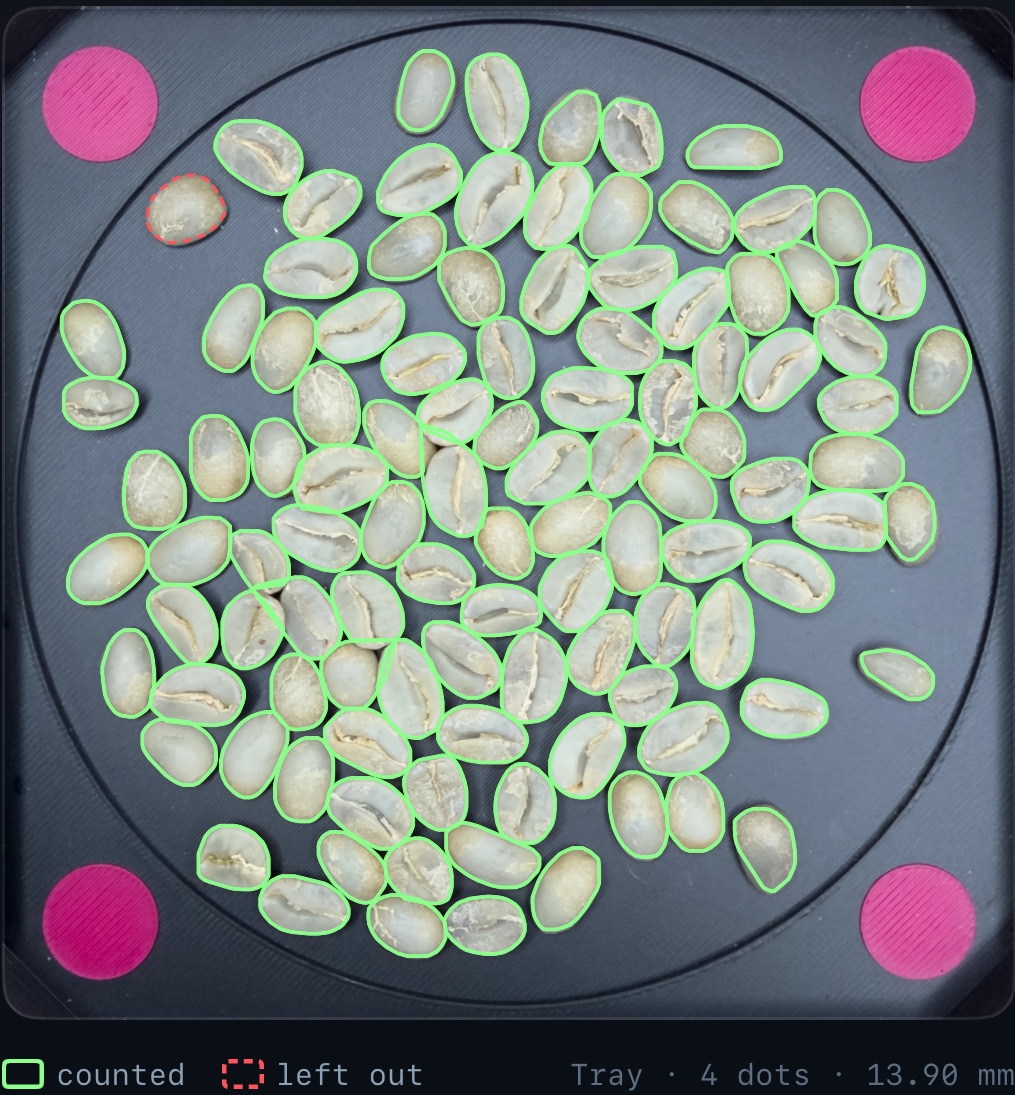
Fluorescence under 365 nm says something about how a coffee was dried and stored. Upload a UV photo and Prism finds every seed with a model trained on green coffee, counting the fully and partially fluorescent ones and estimating its level of background fluorescence. Photograph up to five trays and it measures every bean for a screen distribution, kept beside your sieve figures and never in place of them.
- Fully fluorescent, partial fluorescence, and background fluorescence as separate figures
- Calibrate for your photo rig by painting the visible glow; mark beans by hand
- Screen size within about 0.05 mm of calipers
- Or capture both on an iPhone with Coffee Spectra
Coffee Spectra, paired
Pair the iPhone app once, and every UV and screen-size scan lands on the right sample in Prism.
Sample roasting
Live sample roasting on Roest, Kaffelogic, Nucleus Link and IKAWA
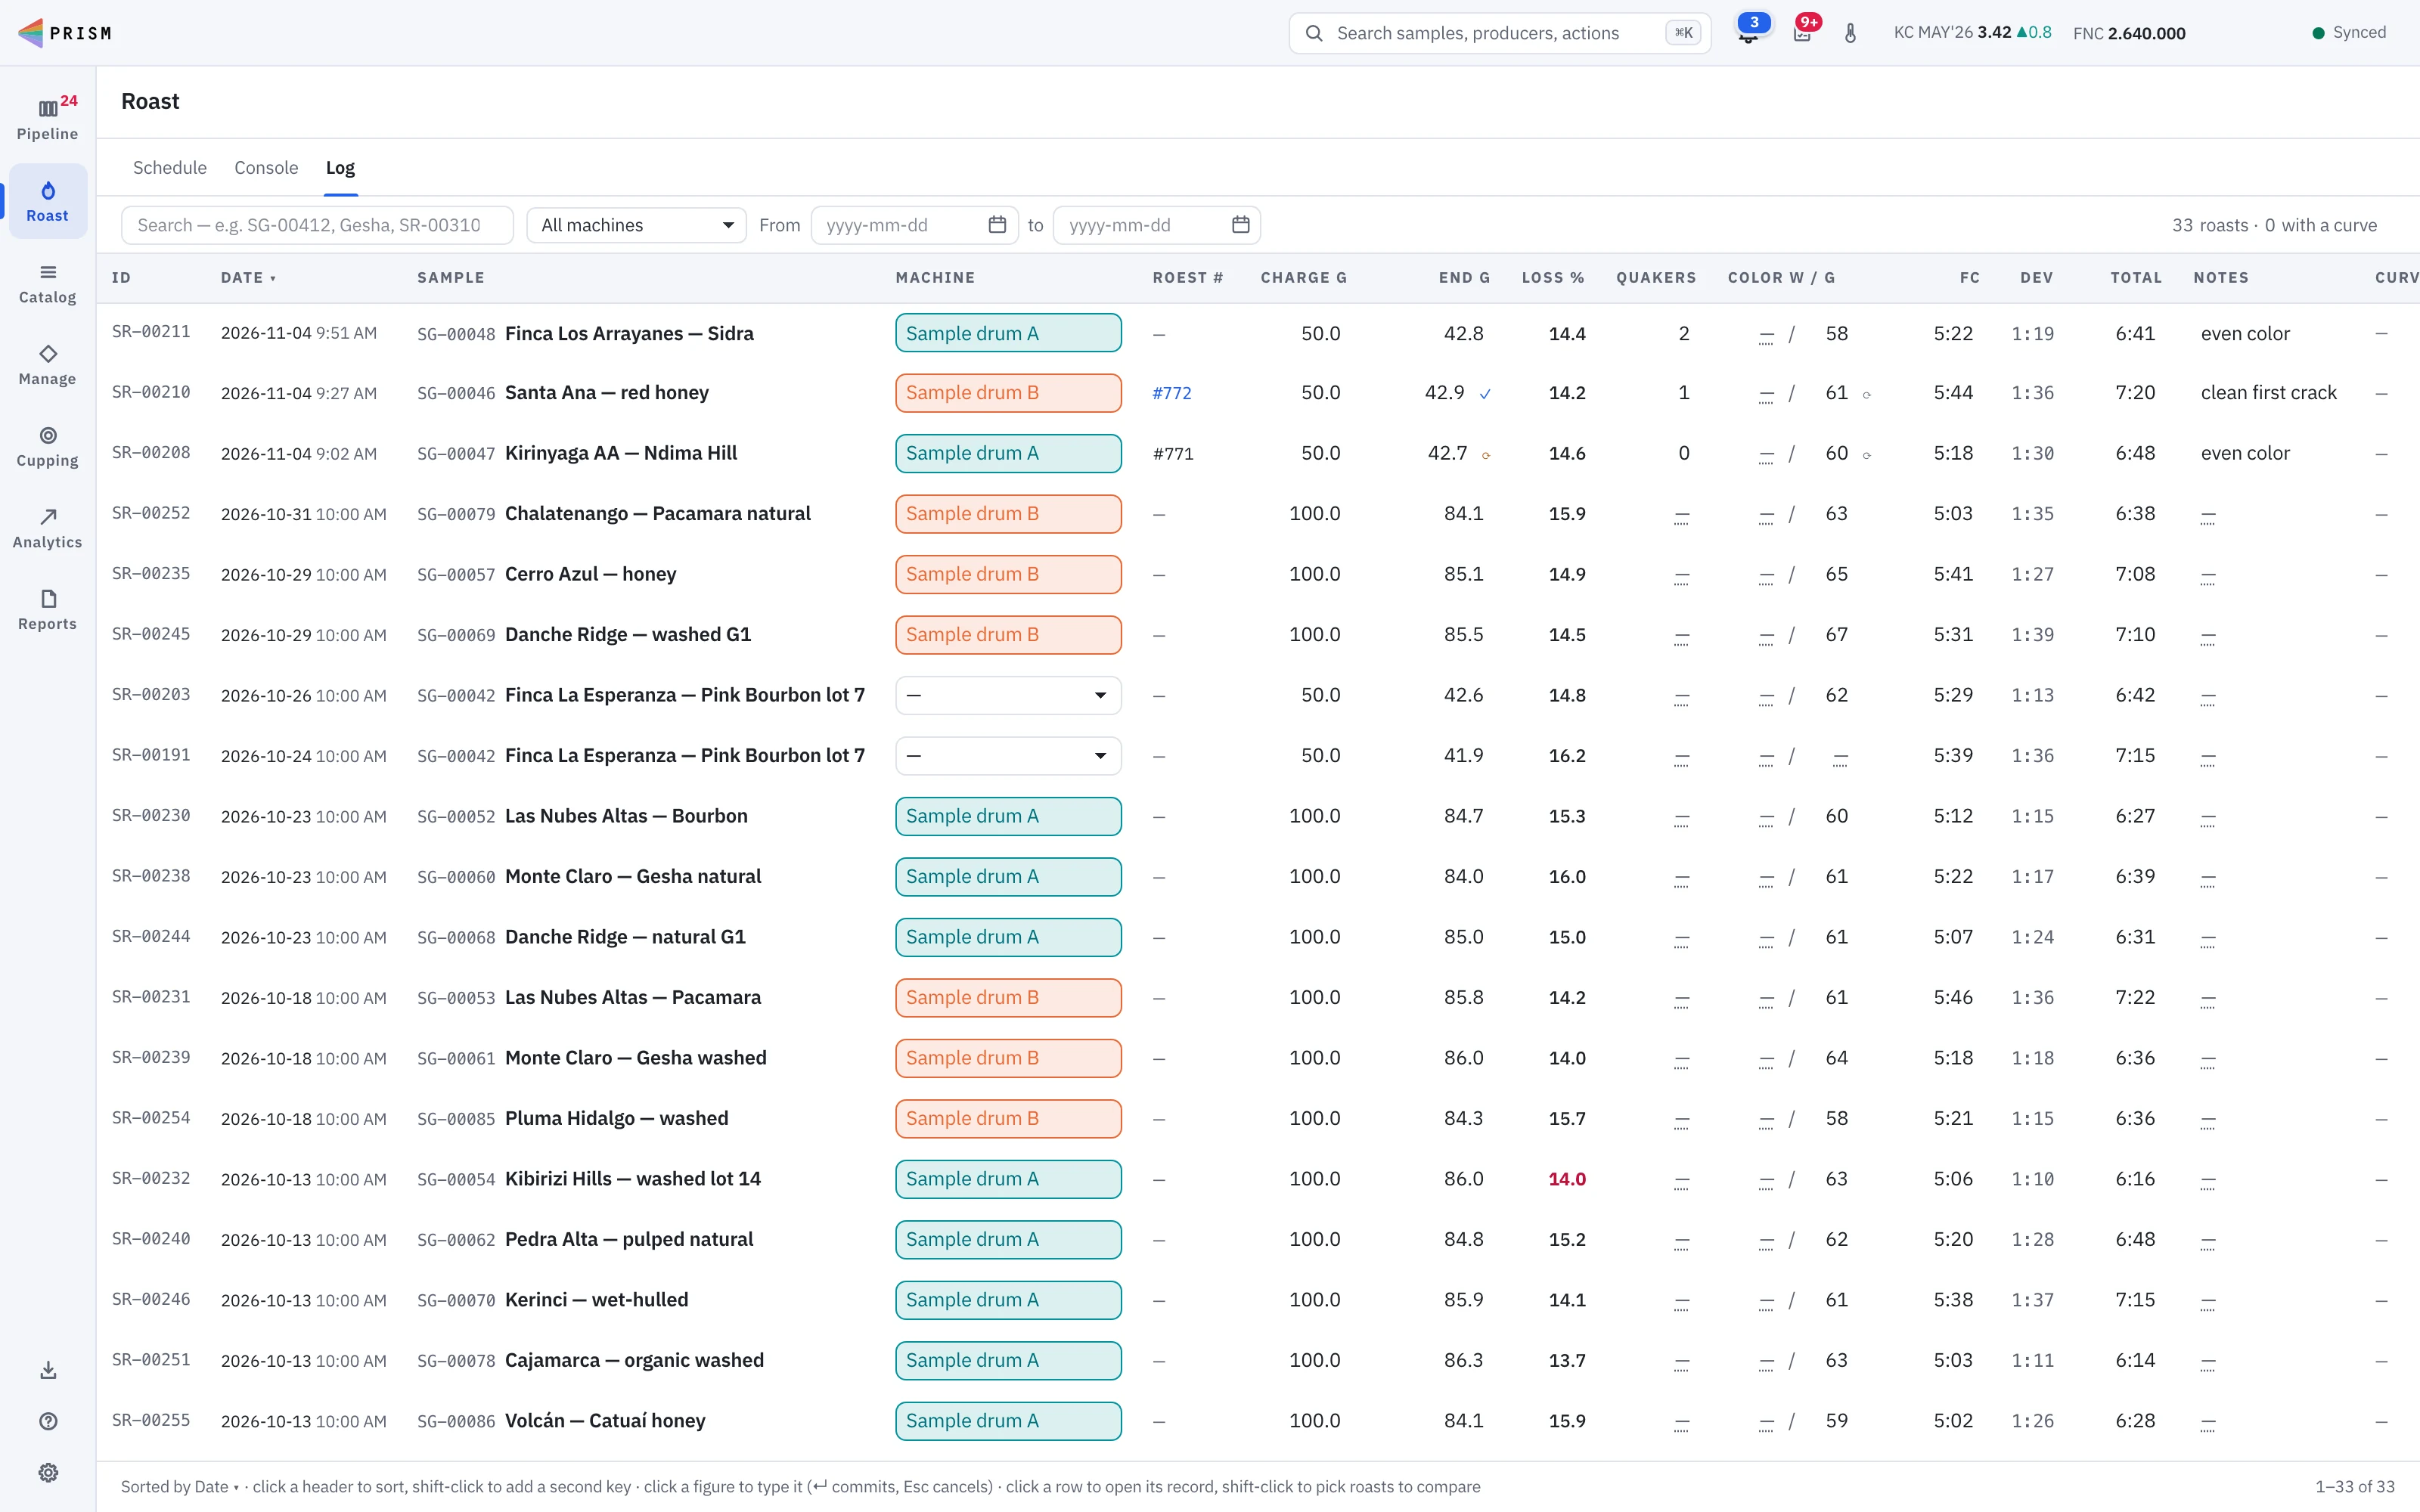
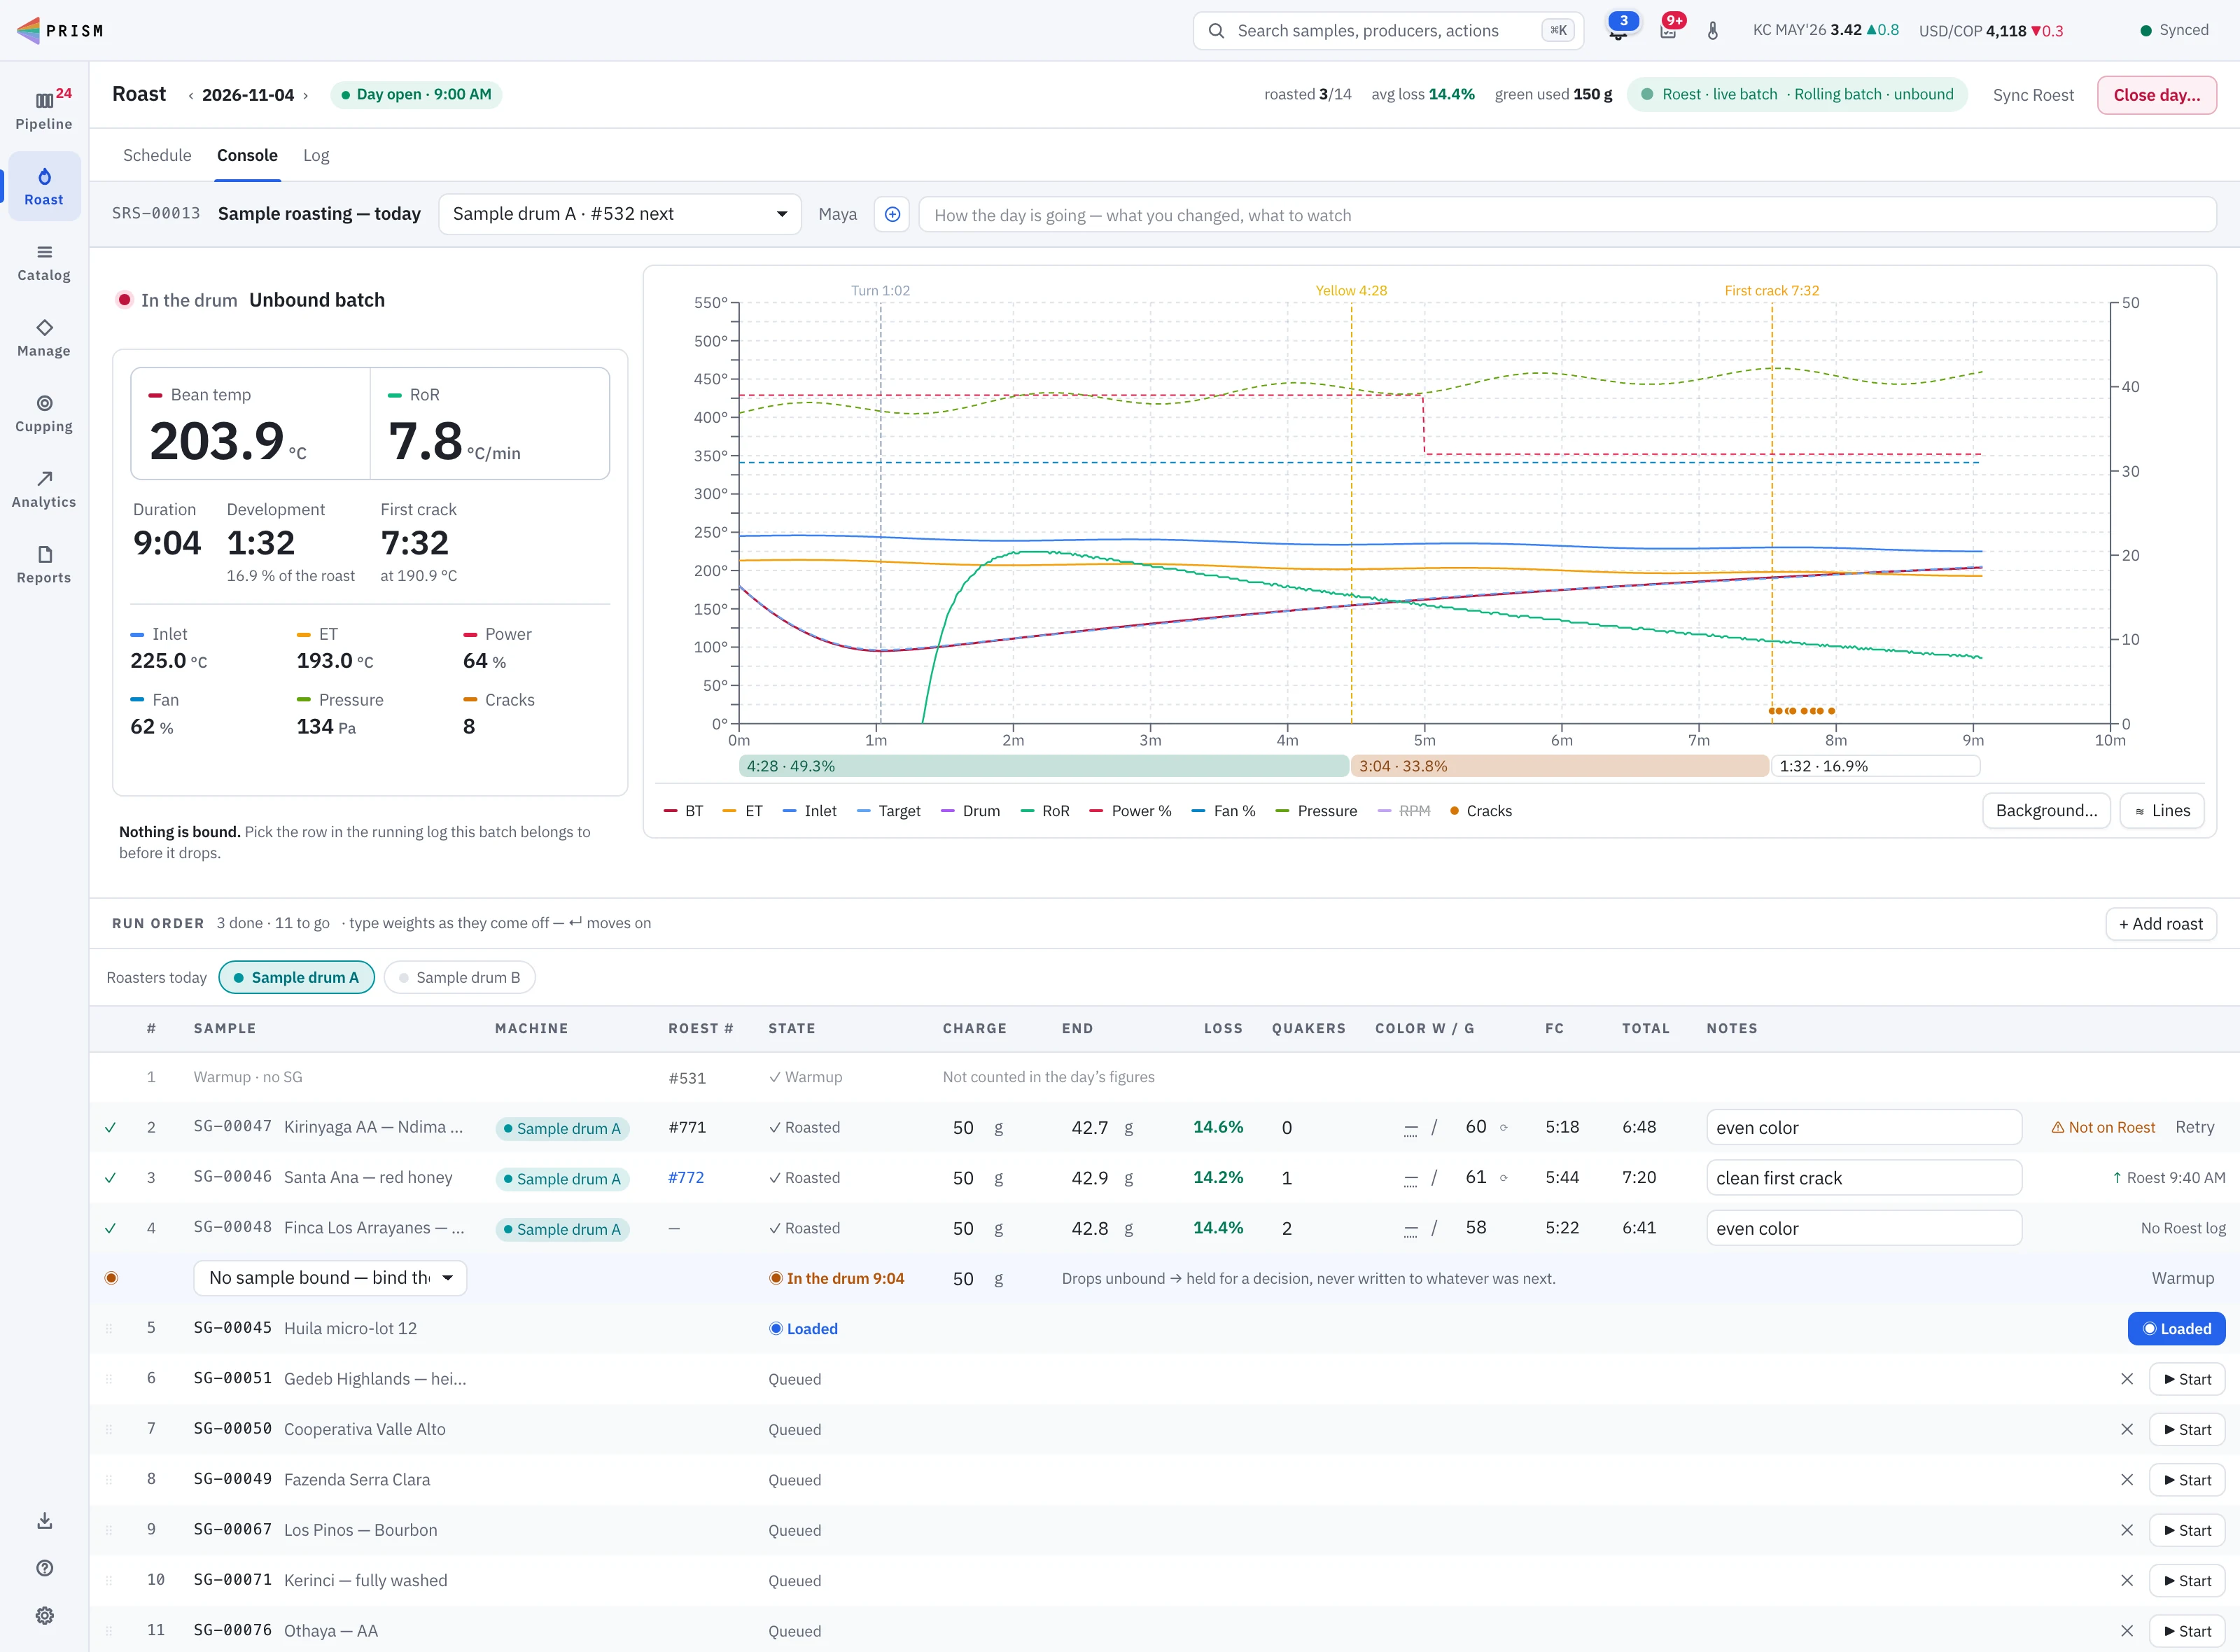
Plan the day’s run order from the board, open the day, and roast. A Roest streams each batch live; a Kaffelogic or Nucleus Link does the same over USB to the Prism Mac app, and an IKAWA over Bluetooth to Prism Desktop. Each batch lands as a row in the run order: type its end weight, quakers and color as it comes off, and roast loss is worked out and anything out of band is flagged for a re-roast.
- Schedule, console and log for each roasting day
- Live curves from Roest, Kaffelogic, Nucleus Link and IKAWA, several roasters at once
- IKAWA Pro V2, Pro V3 and PRO X: Prism listens while you run the roast from the roaster or its app
- Yellow and first crack marked for you at the temperatures you set, and moved to a typed time
- Any channel of a reference roast drawn behind the live one, with the difference under its readout
- Curves stored with the roast, even if the roaster’s log is deleted
- Roast loss checked against the bean’s own moisture
- Any other roaster: type the weights, or attach a Kaffelogic or Artisan log
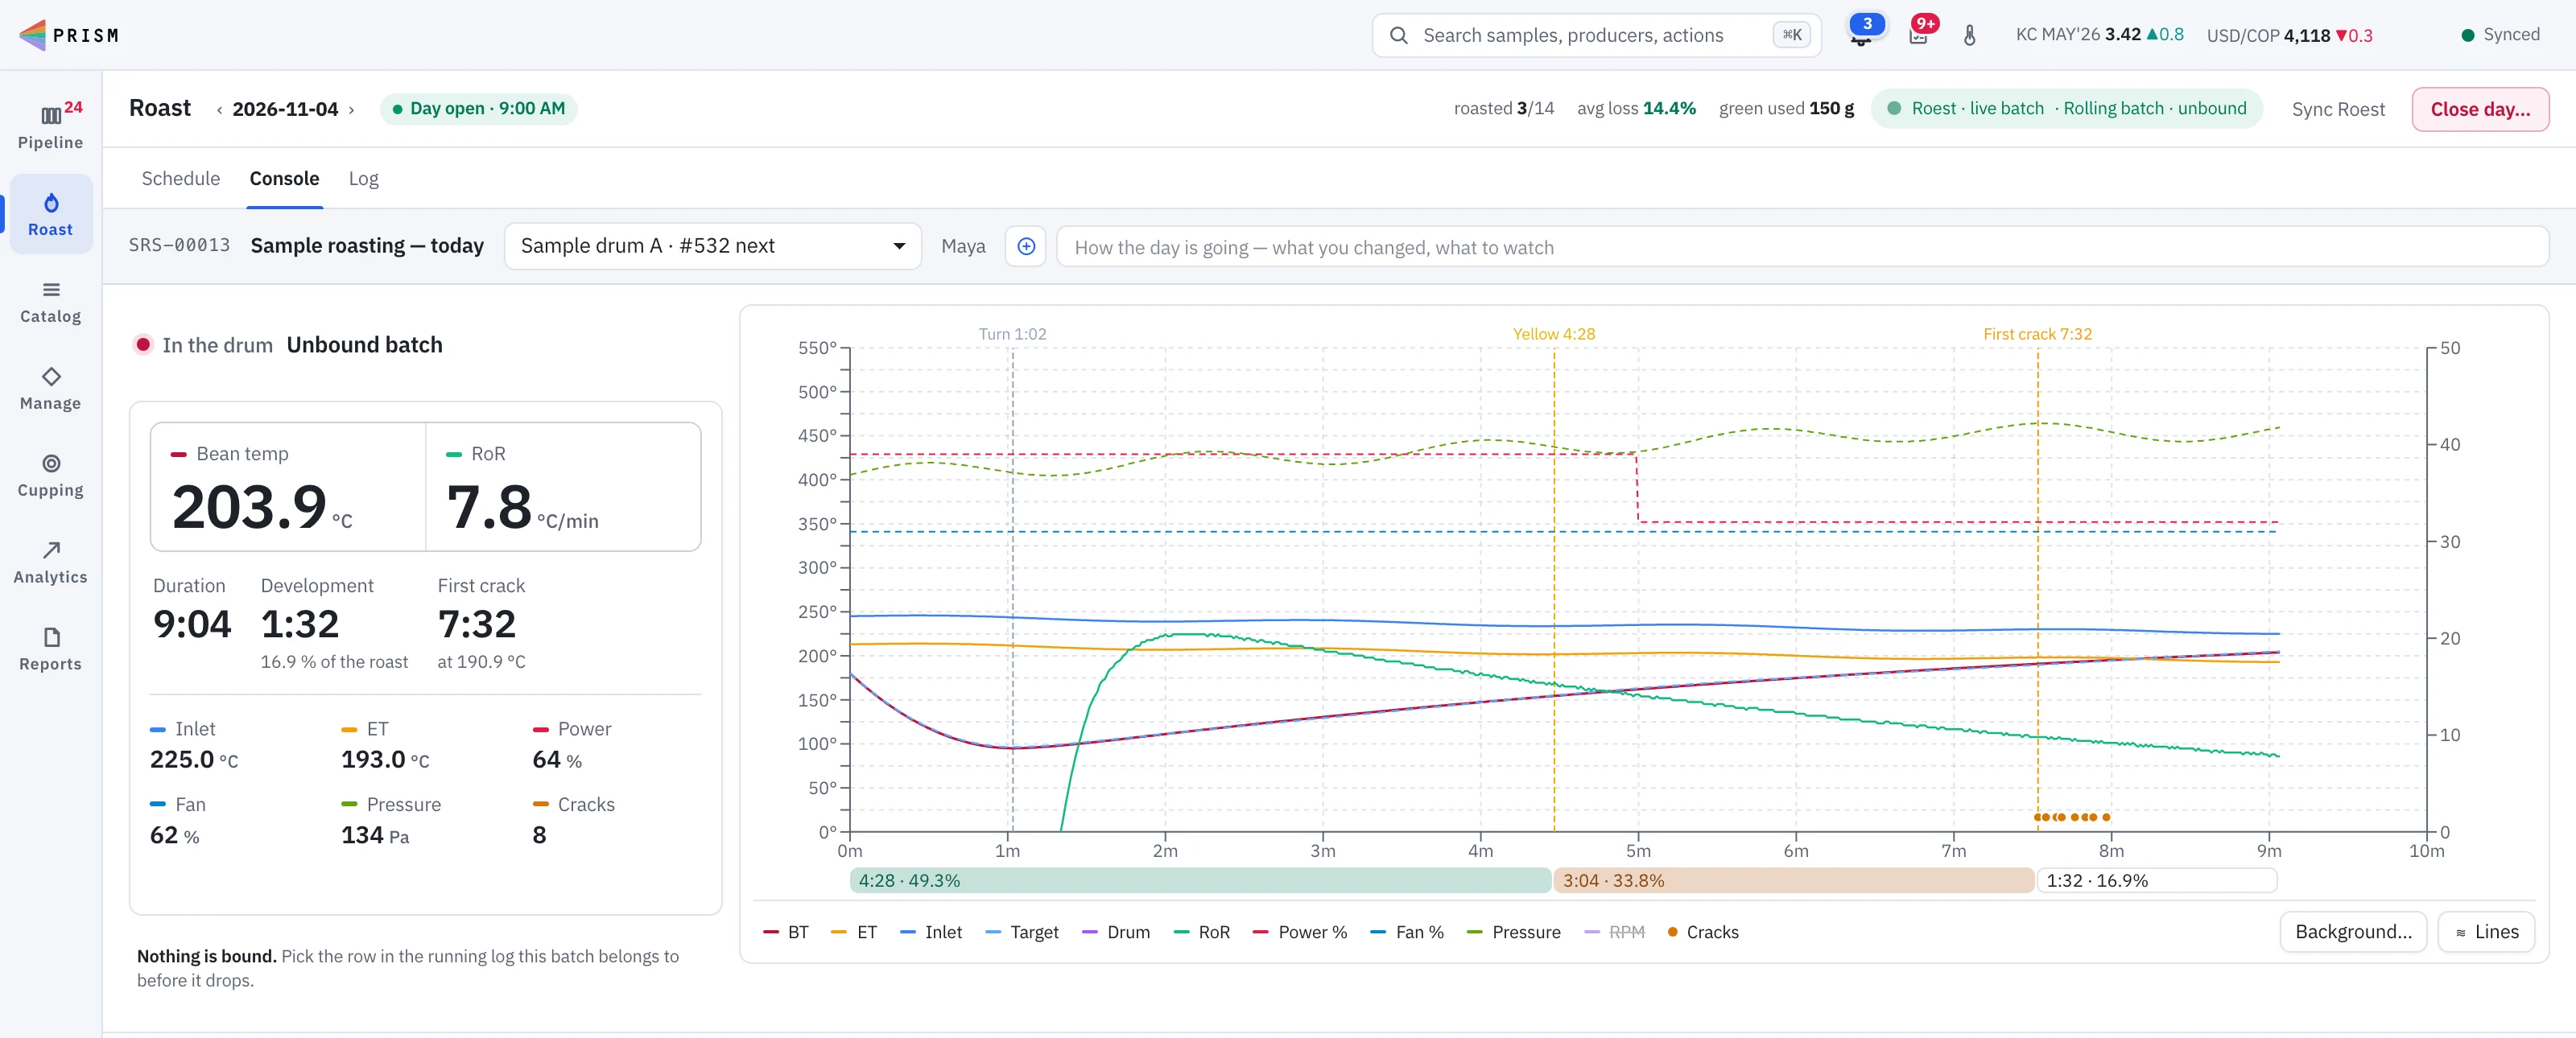
Live: the batch in the drum, drawn as it roasts, with Yellow and first crack marked for you.
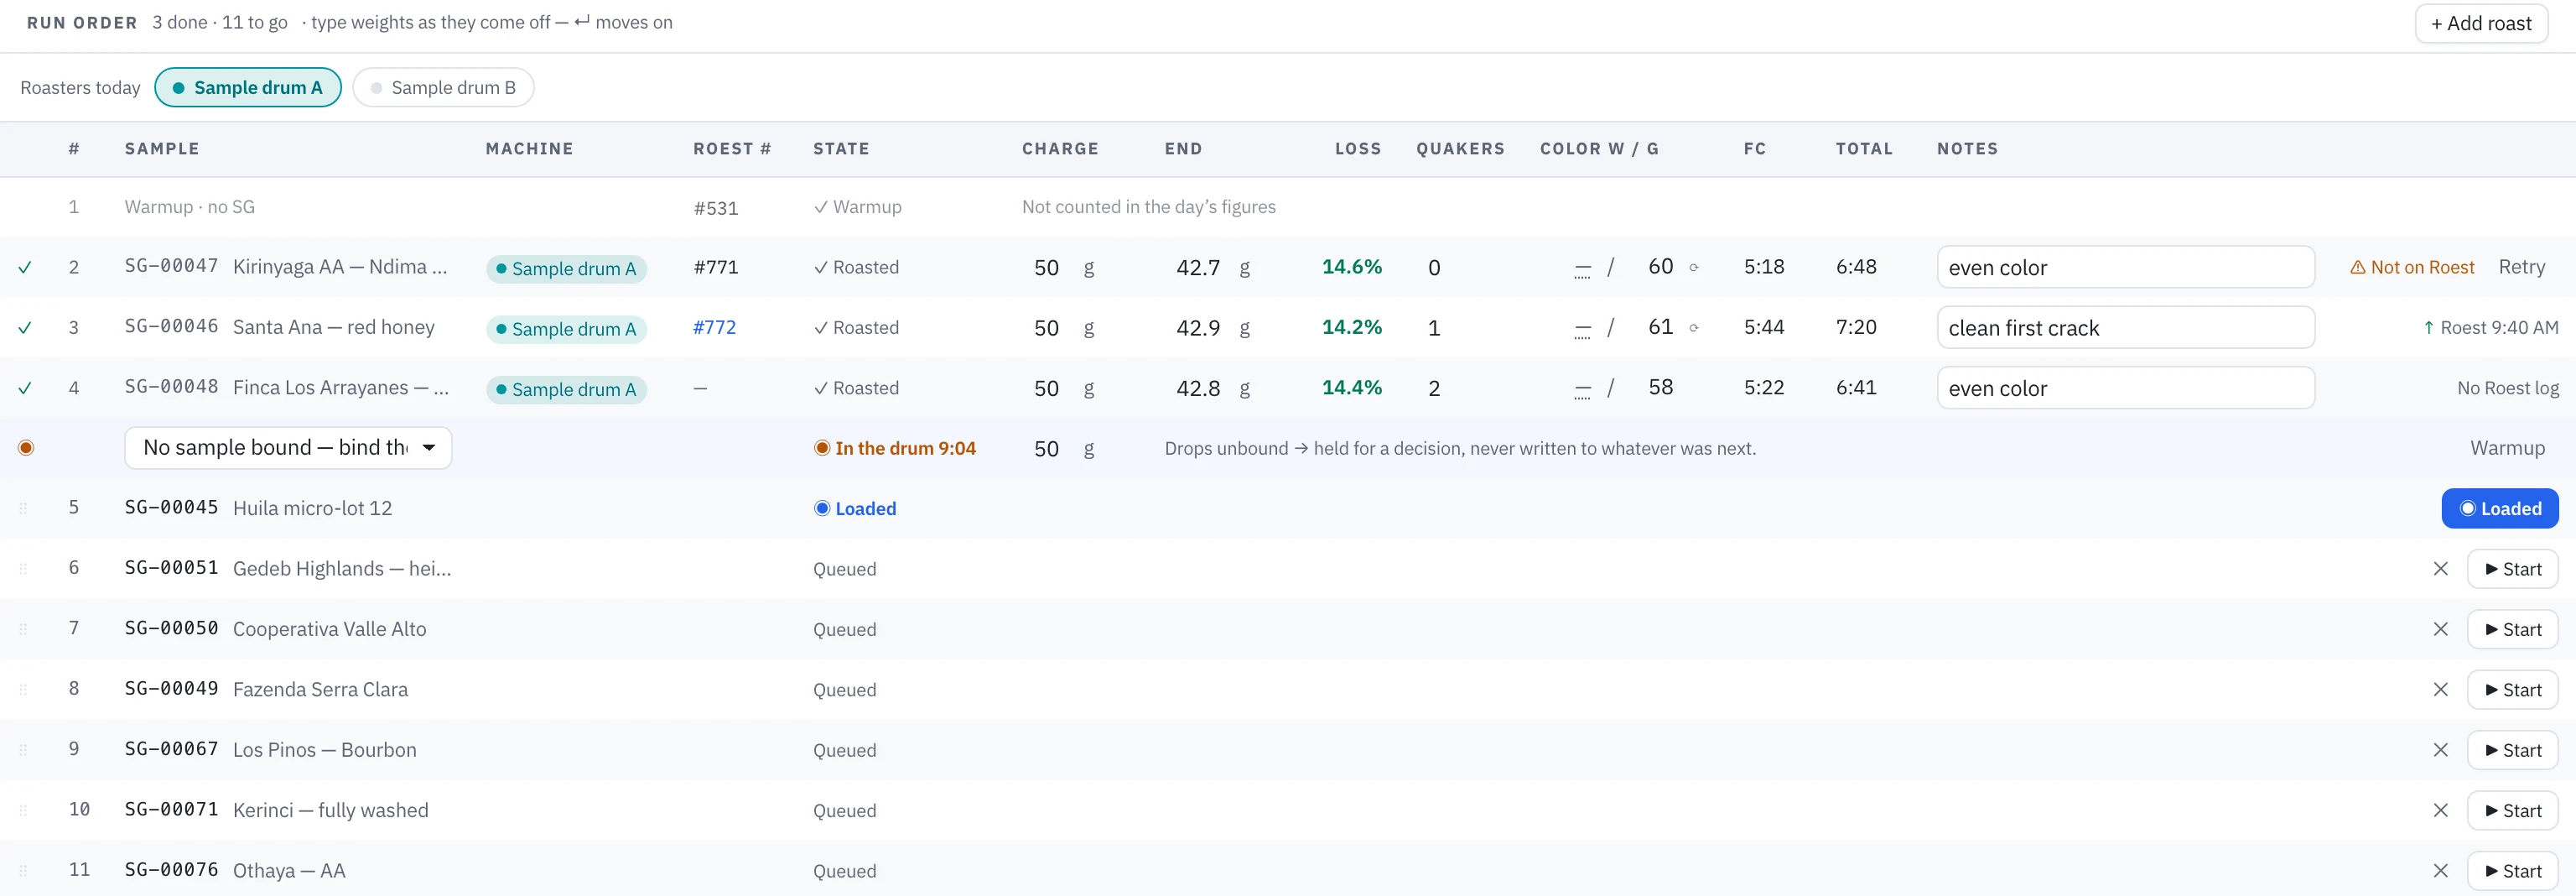
Run order: type the end weight, quakers and color as each batch comes off, and roast loss works itself out, checked against the bean’s moisture. The in-drum batch and the samples still to roast sit below.
Prism Desktop for Mac and Windows
A desktop app for the bench, on Mac or PC
Prism Desktop is the same Prism in a window of its own, for Mac and for Windows. On the roasting bench it does what a browser cannot: it talks to a Kaffelogic or Nucleus Link sample roaster over USB, or listens to an IKAWA over Bluetooth, and draws each roast live, and it records a roast the moment Kaffelogic Studio copies the log off the roaster, with nothing to move by hand.
- The full Prism Lab in its own window, on Mac or Windows
- Live Kaffelogic and Nucleus Link curves over USB: bean temperature, profile and rate of rise
- Live IKAWA curves over Bluetooth: exhaust temperature, with charge and drop marked from the roaster
- Roasts recorded automatically from Kaffelogic Studio’s logs
- Signs in to your own server, two-factor sign-in unchanged
- Apple Silicon Macs on macOS 13 or later, and 64-bit Windows PCs
Mobile-ready cupping
Blind cupping on any phone, for the team and your guests
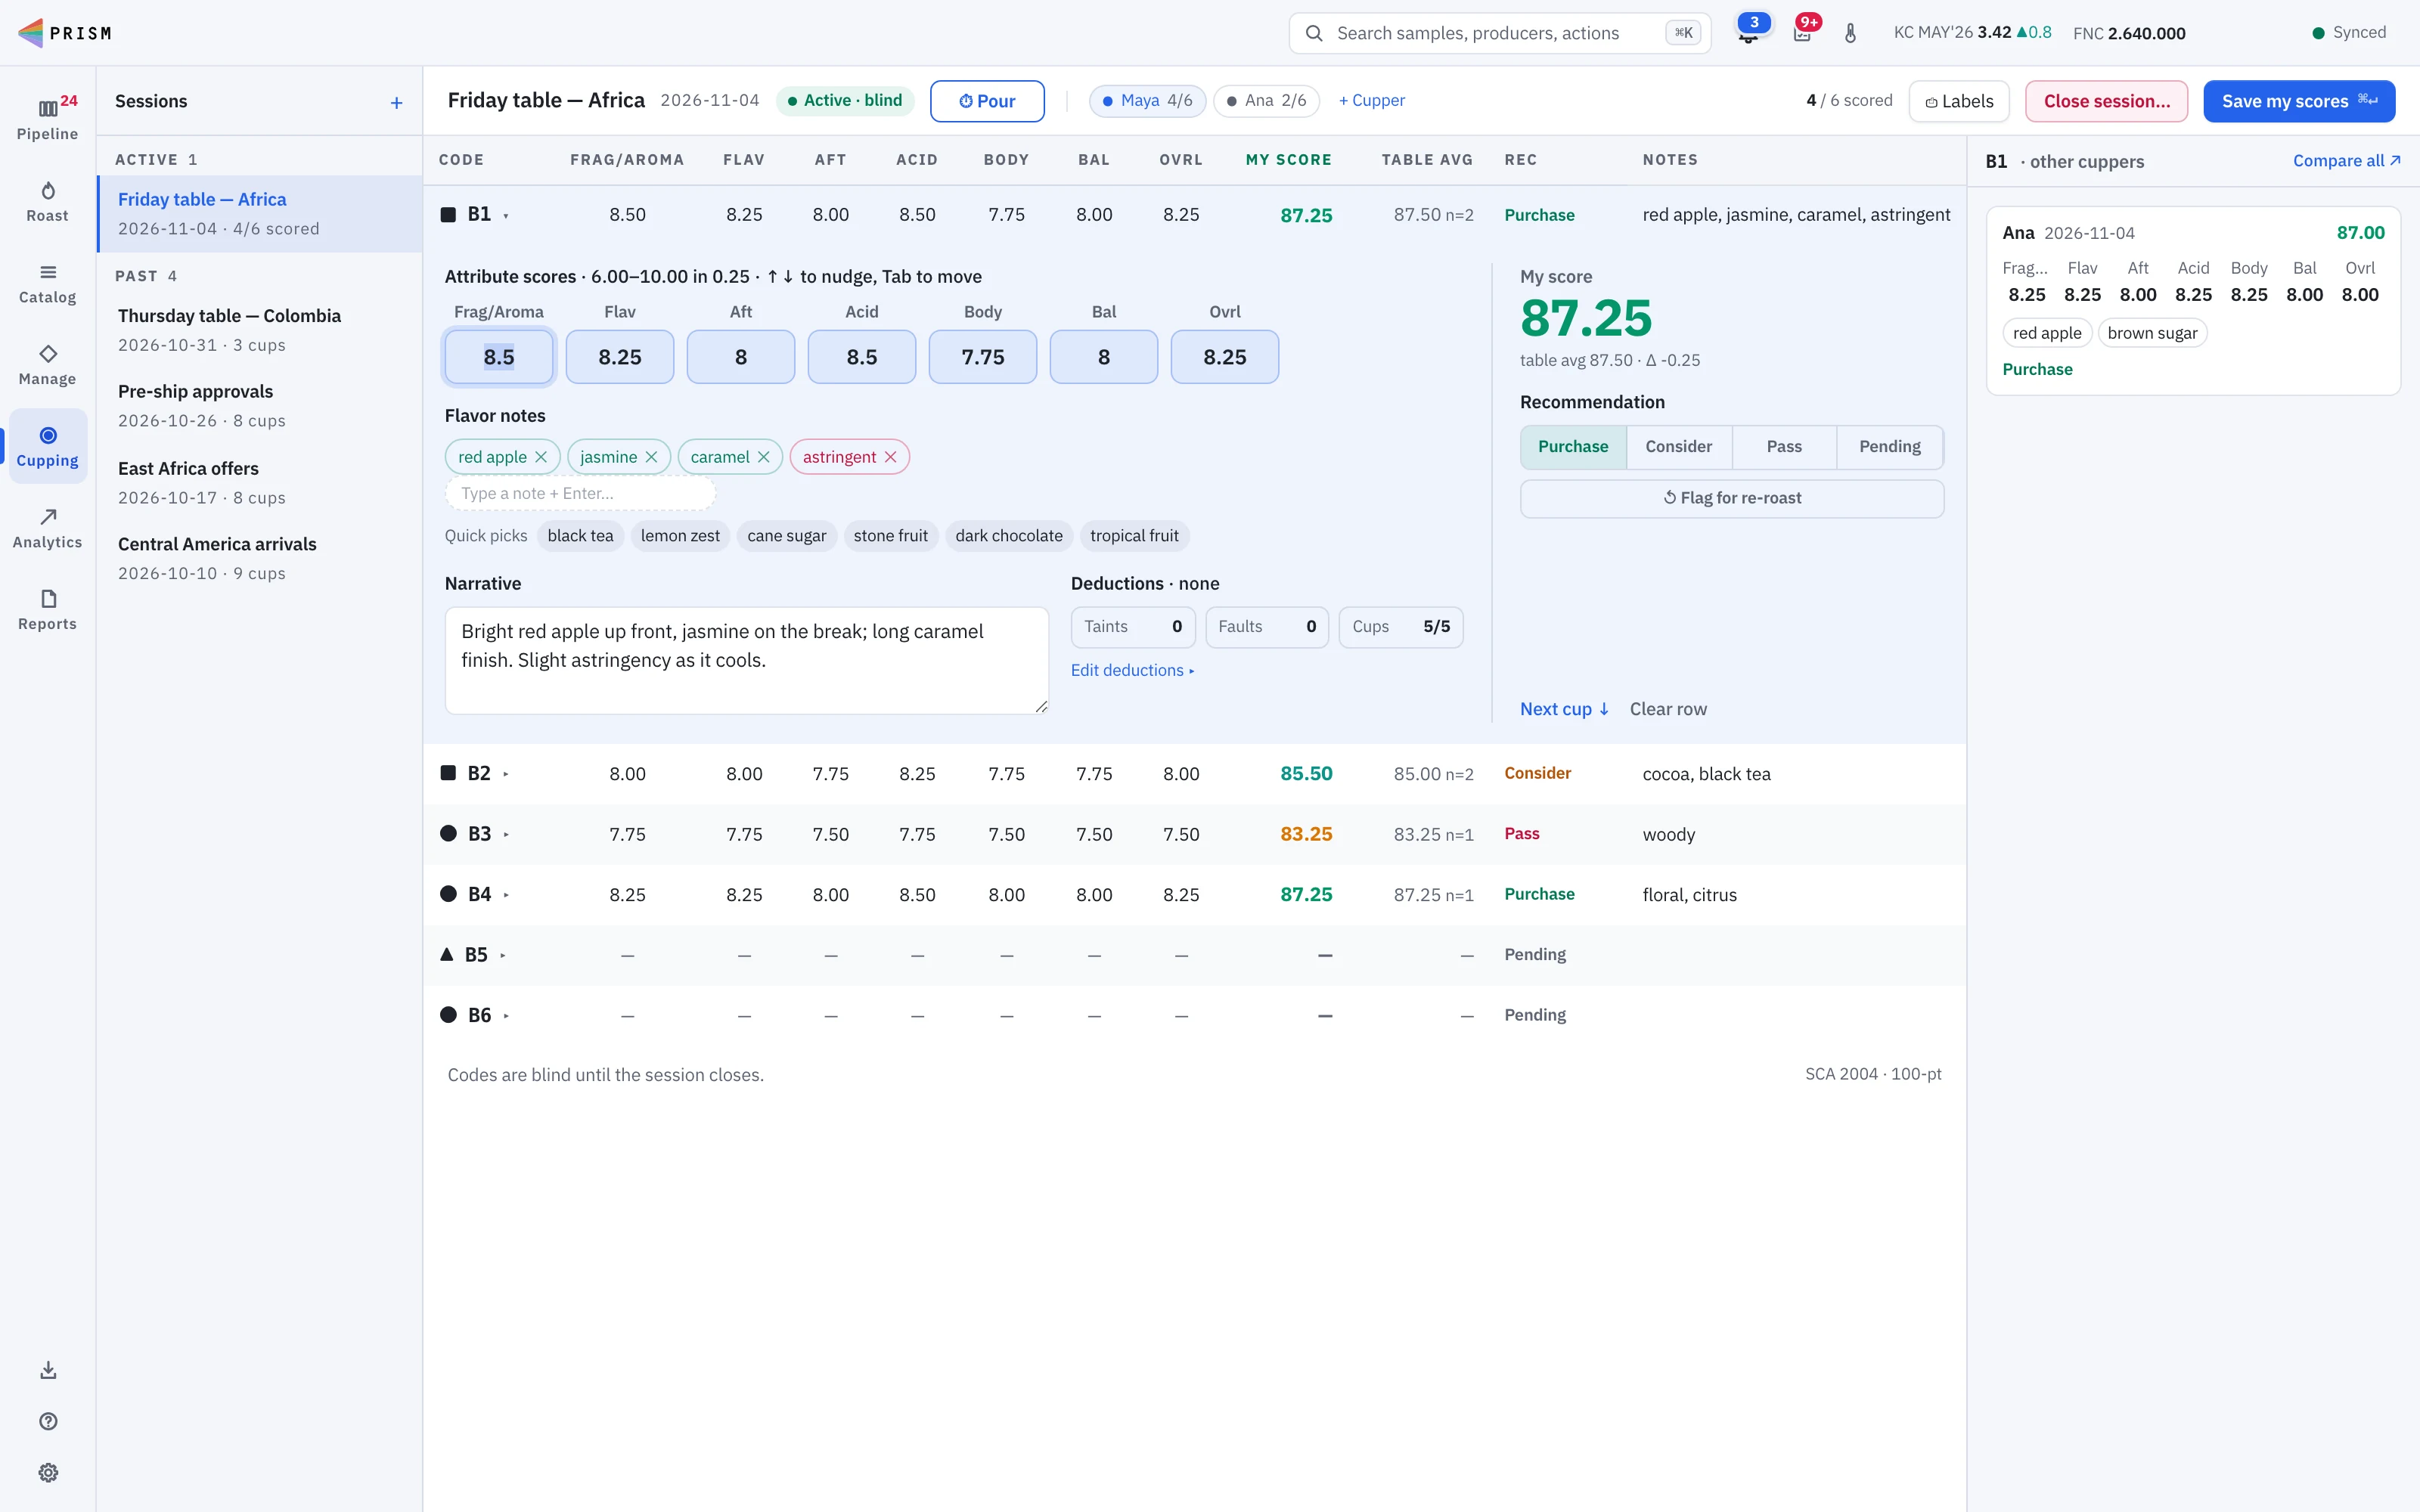
Lay the table and Prism assigns blind codes, grouped by process and shuffled within each group, with a shape per process on the printed tags. Pick the score sheet for each session (SCA 2004, Cup of Excellence and SCA CVA are built in), each with its own attributes and total. Everyone scores at once, on a laptop or one-handed on a phone. Invite outside cuppers with a link: they score on their own phone with no account, and never see which coffee is which. For a public event, turn on Open cupping: anyone with the session’s join code can take a seat as a guest in the Prism Cup iPhone app, with no account and no limit on numbers, wherever in the world they are cupping.
- SCA 2004, Cup of Excellence and SCA CVA score sheets, with a default for the lab
- Phone scoring built for one hand, with a pour timer that calls the break at 4:00
- Scores save as you go and survive a dropped connection
- Multi-cupper sessions with every cupper’s scores side by side
- Guest cuppers by invite link, counted or left out of the average
- One Join QR per session, big enough to scan across the table, that stops working when the session closes
- Open cuppings for public events, with cuppers joining by QR code from anywhere in the world
- A bar chart of where the table disagrees, before you close
Prism Cup for iPhone
The cupping table, in an iPhone app
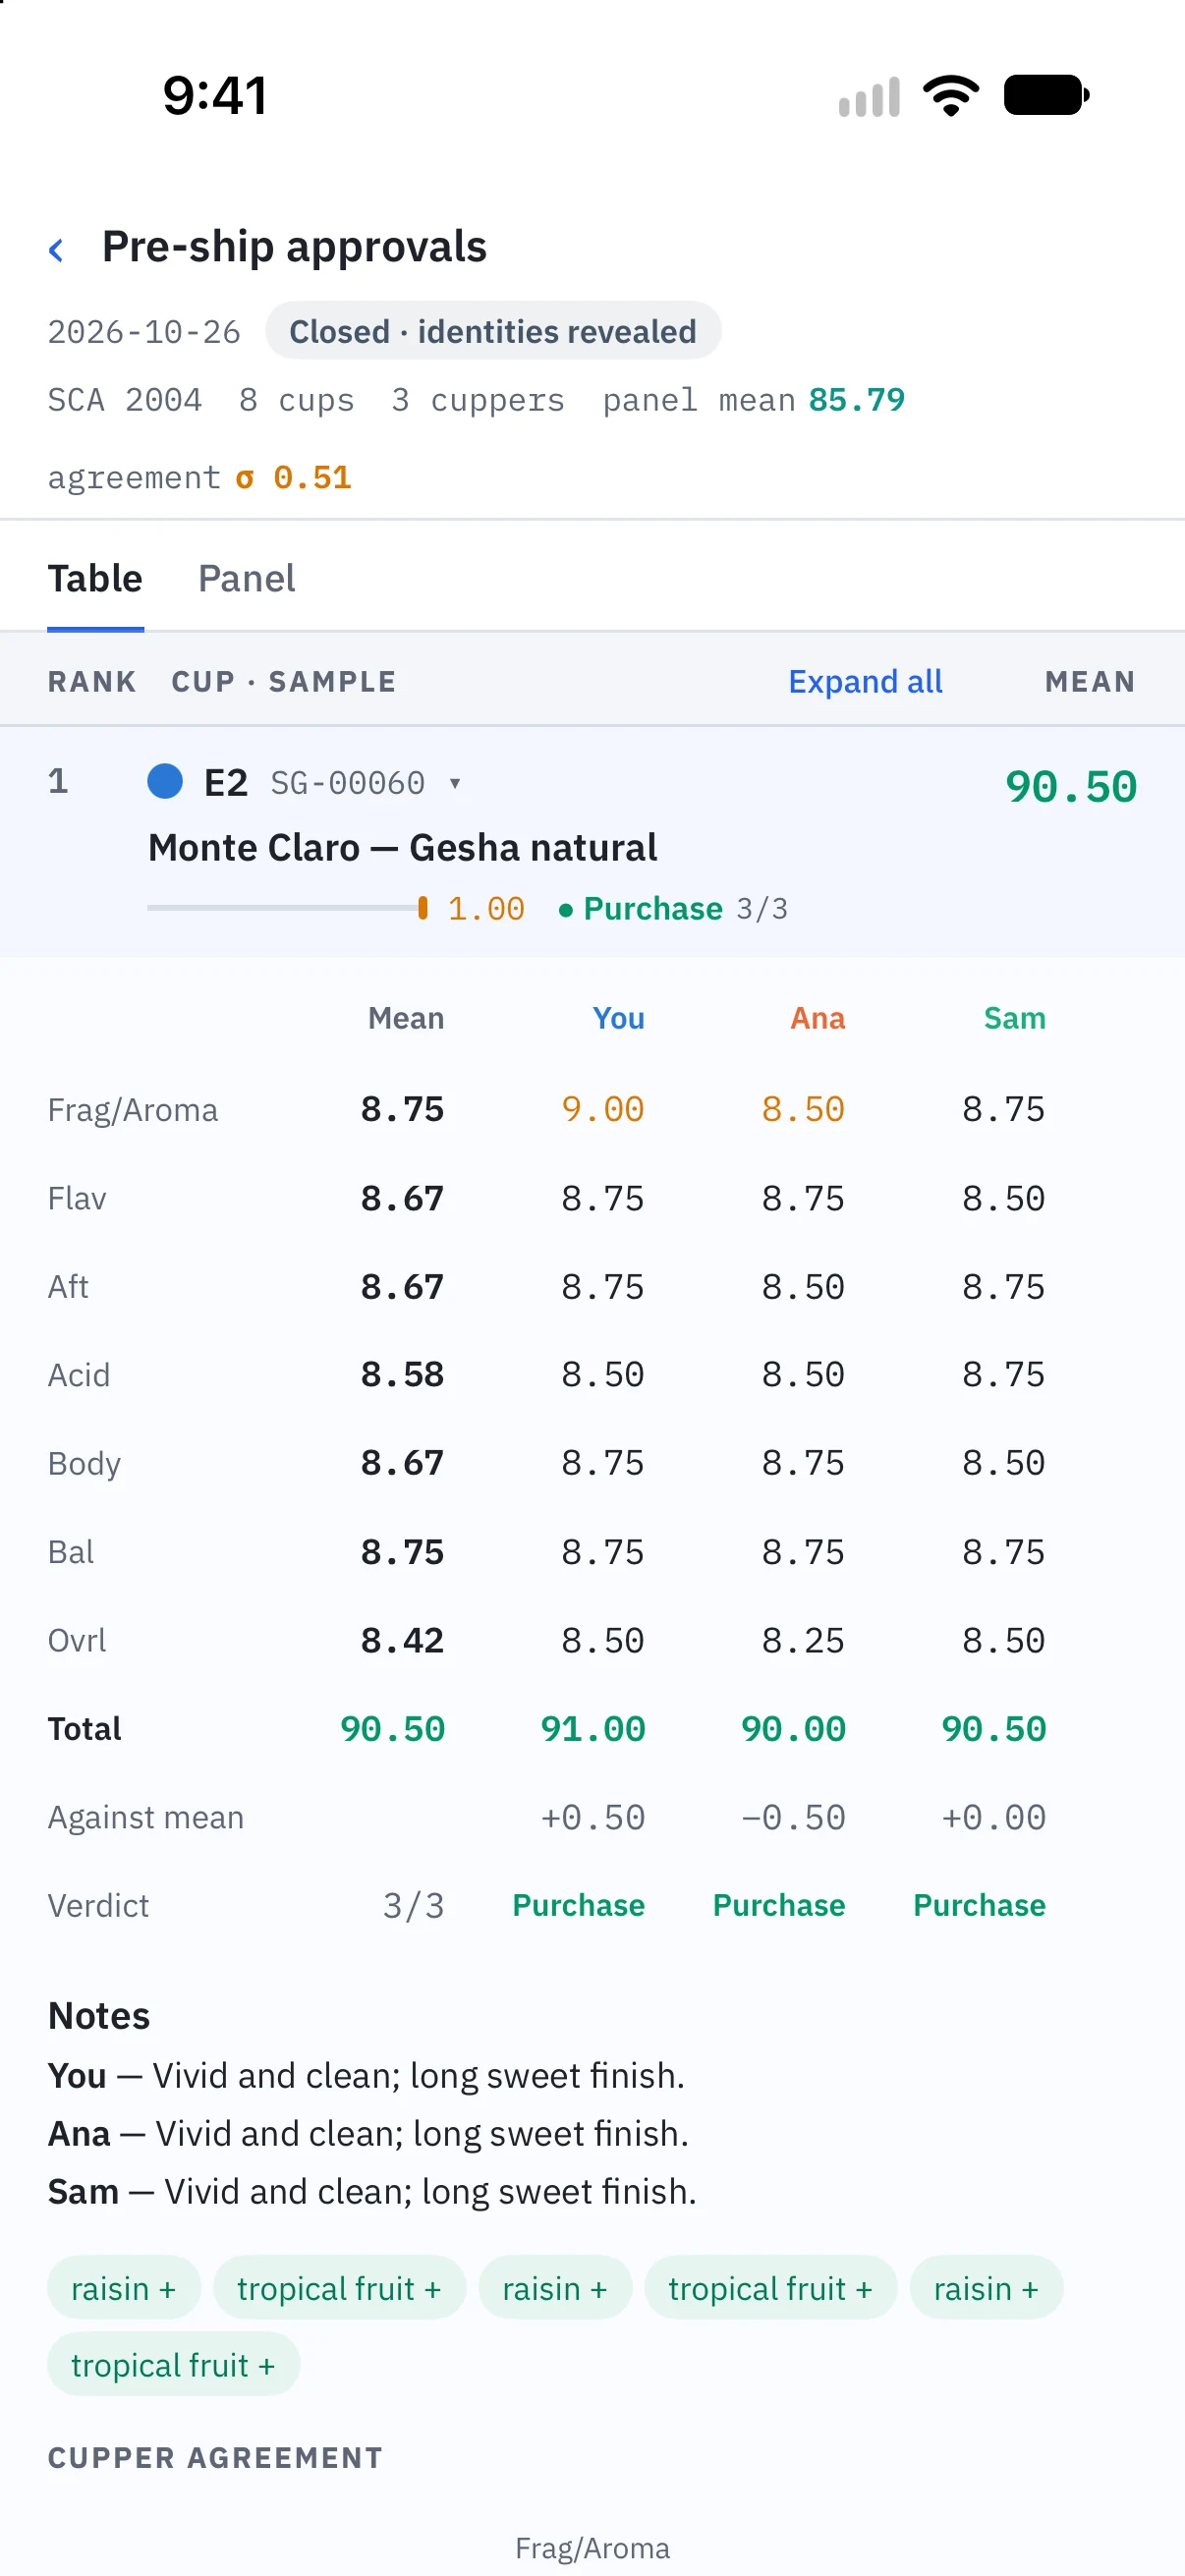
Prism Cup is the native iPhone app for cupping with Prism. Scan a code from Prism to sign in once, see every session you can join, and score with a pour clock and a real alarm at 4:00. Build a session and print its labels from the phone, then read the full report once it closes. A guest needs only an invitation: no account, no server address and no password.
- Sign in by scanning a code from Prism, and stay signed in
- A pour clock with a real alarm at 4:00
- Scores save offline and send when the connection returns
- Build a session, scan sample barcodes, and print labels by AirPrint or PDF
- Closed sessions read as Prism’s report, on and off the network
- An iPhone on iOS 17 or later
After the session
A panel report, not a pile of scoresheets
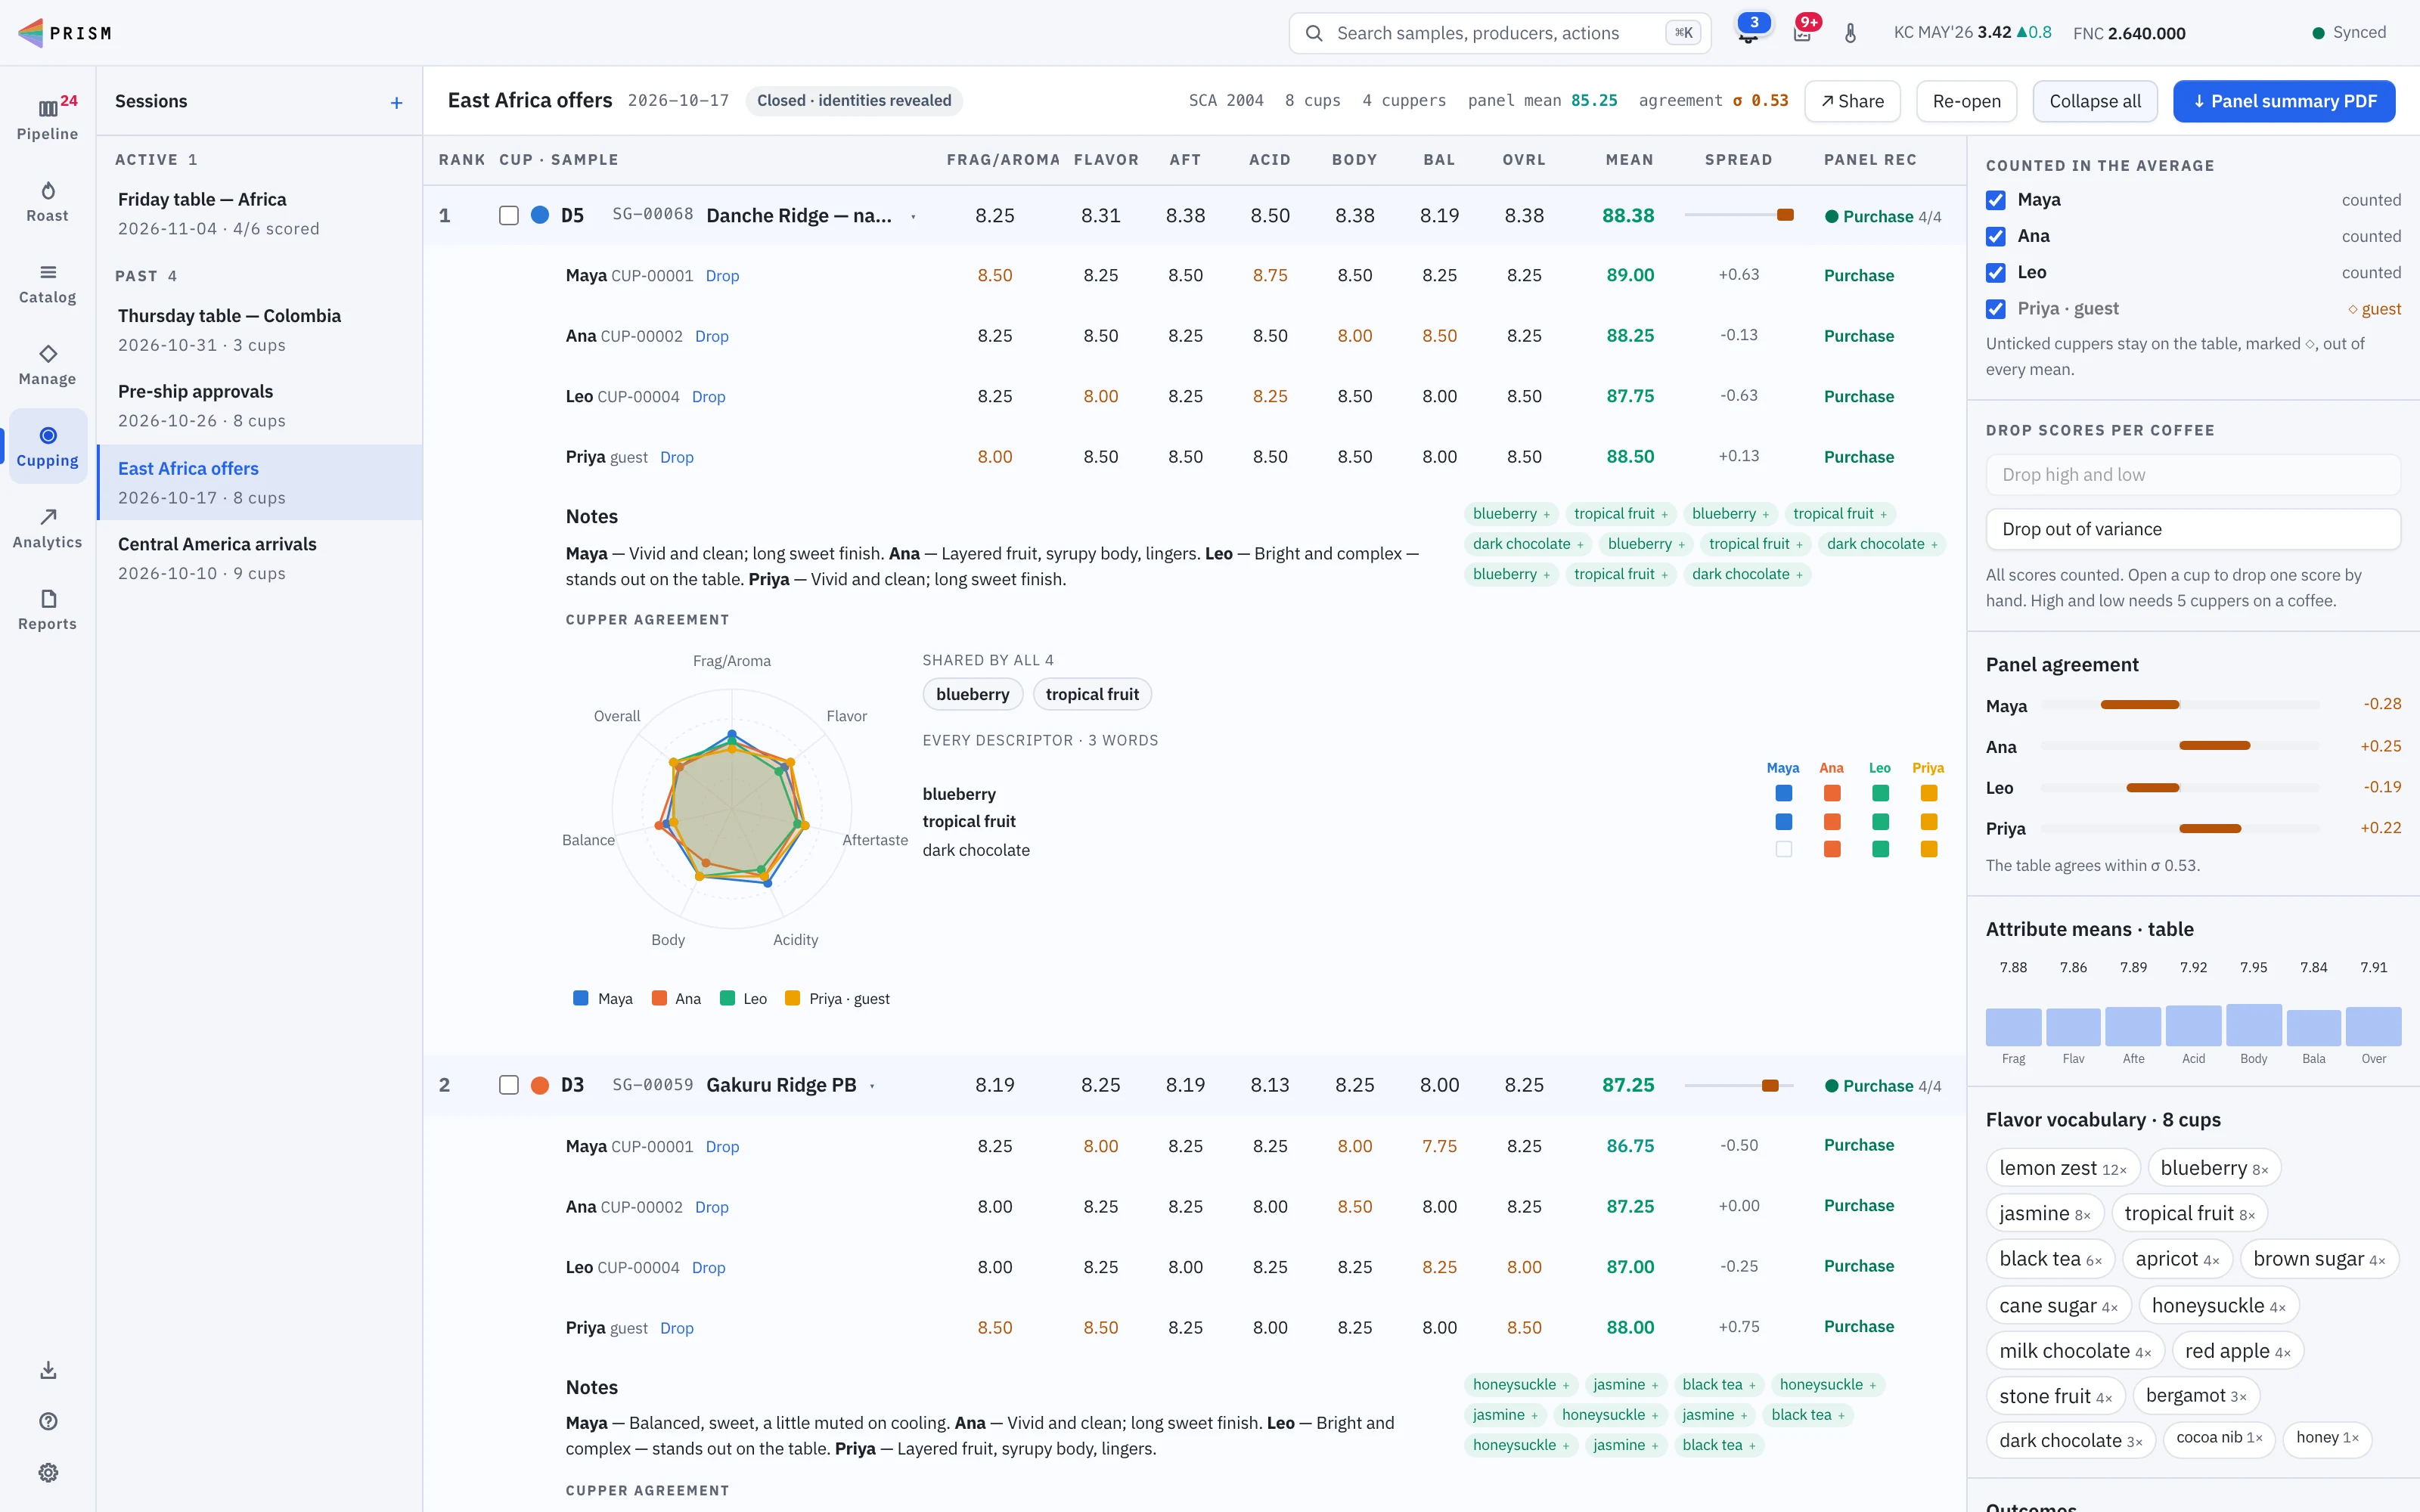
Closing a session attaches every score to its sample, merges the flavor notes and moves each coffee on. The report ranks the table by panel mean, shows how far apart the cuppers were on each cup, each person’s bias against the table, and the session’s flavor vocabulary.
- Every score names its form, on the report, the PDF and share links
- Panel mean, spread and recommendation with the vote behind it
- Each cupper’s bias against the table
- Flavor vocabulary sized by how often a word came up
- A panel PDF, and a share link for suppliers and customers
Lab reports
Reports you shape, for whoever reads them
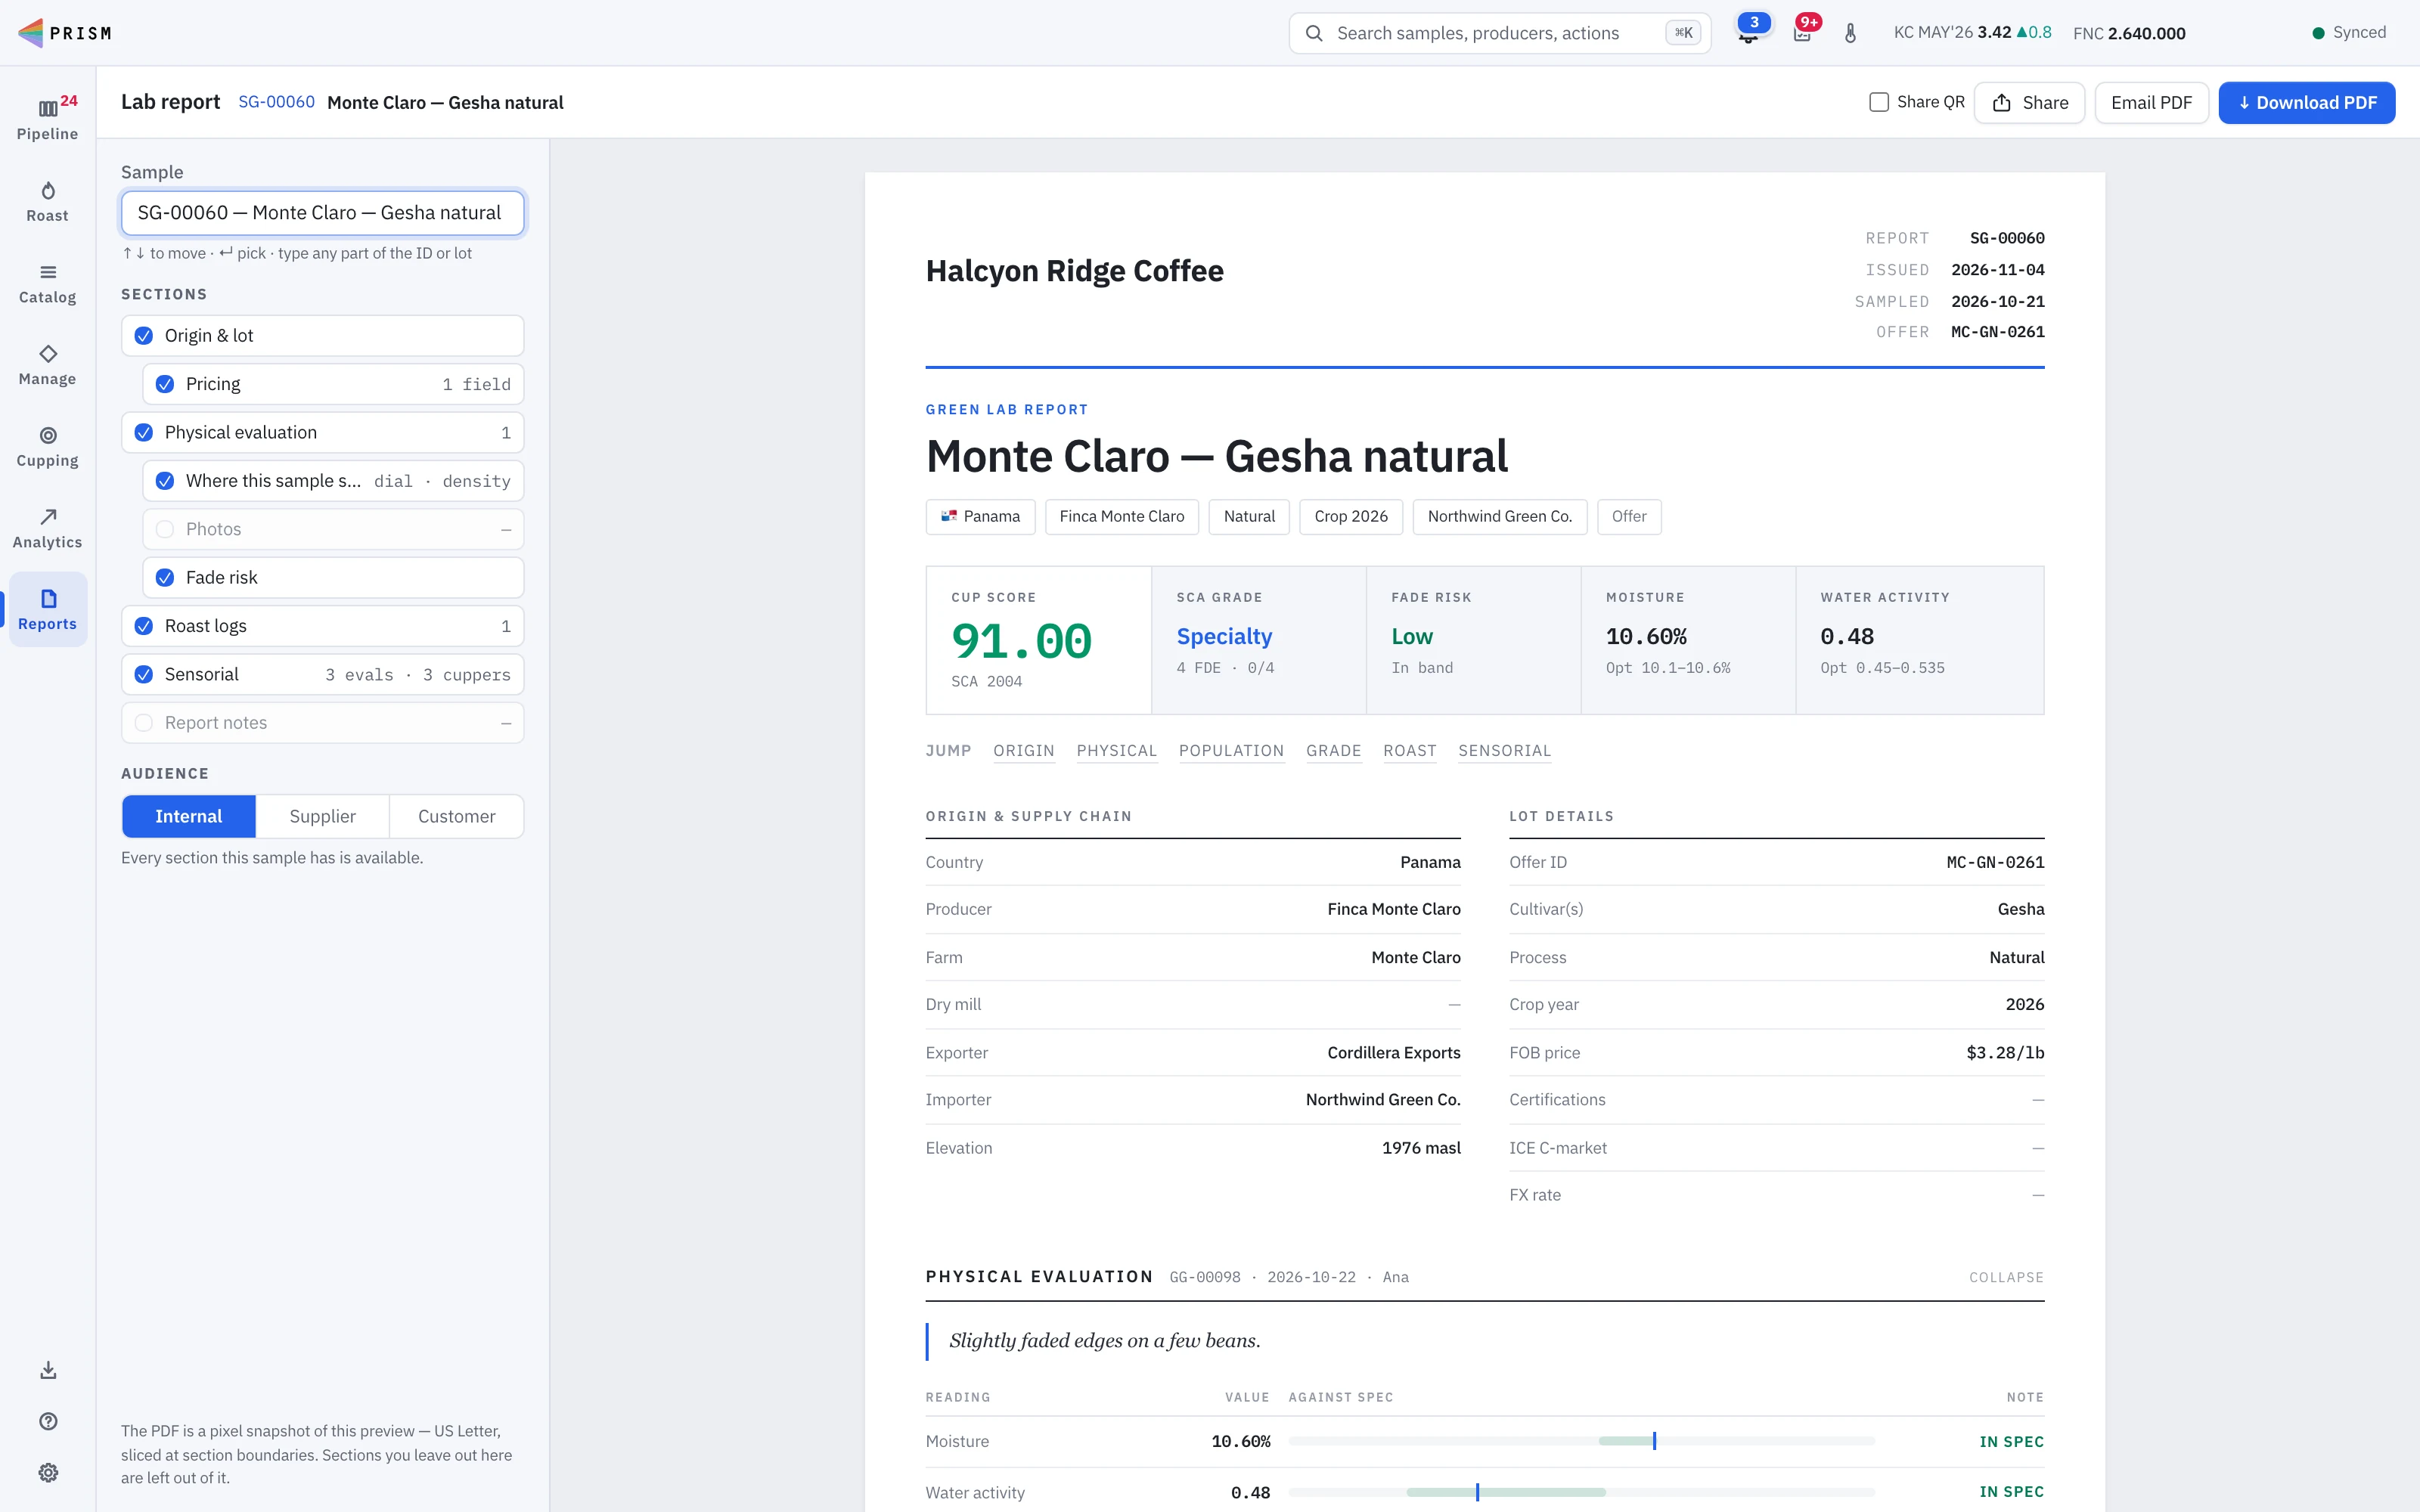
Pick which sections a report carries and who it is for. A supplier copy, a customer copy and an internal copy show the right figures and leave out the rest. The PDF is exactly the preview beside you, with your logo, your company name and your own methods statement at the foot.
- Choose the sections, per report
- Internal, supplier and customer versions
- Your meters and their accuracy printed in the methods block
- Email the PDF to the importer, exporter and producer on file
- Bulk lab reports and sales sheets from the catalog
Lifecycles
Follow one coffee from type sample to arrival
A coffee is sampled again and again on its way to you: a type sample, offers, pre-shipment, arrival, spot. Link them as one lifecycle and every sample shows the whole path, with the offer that went forward marked. Prism suggests the link while you register a sample, from its producer and harvest. Then share a Lifecycle Report: one page charting quality through the buying cycle, with moisture, water activity and UV in every bubble and each stage one click from its lab report.
- Type, Offer, Pre-shipment, Arrival and Spot samples in one lane strip
- Linking suggested while you register, from producer and harvest
- A shareable Lifecycle Report: score over time, with MC, Aw and UV at every stage
- A stage-by-stage table of what changed
- No prices on the shared page
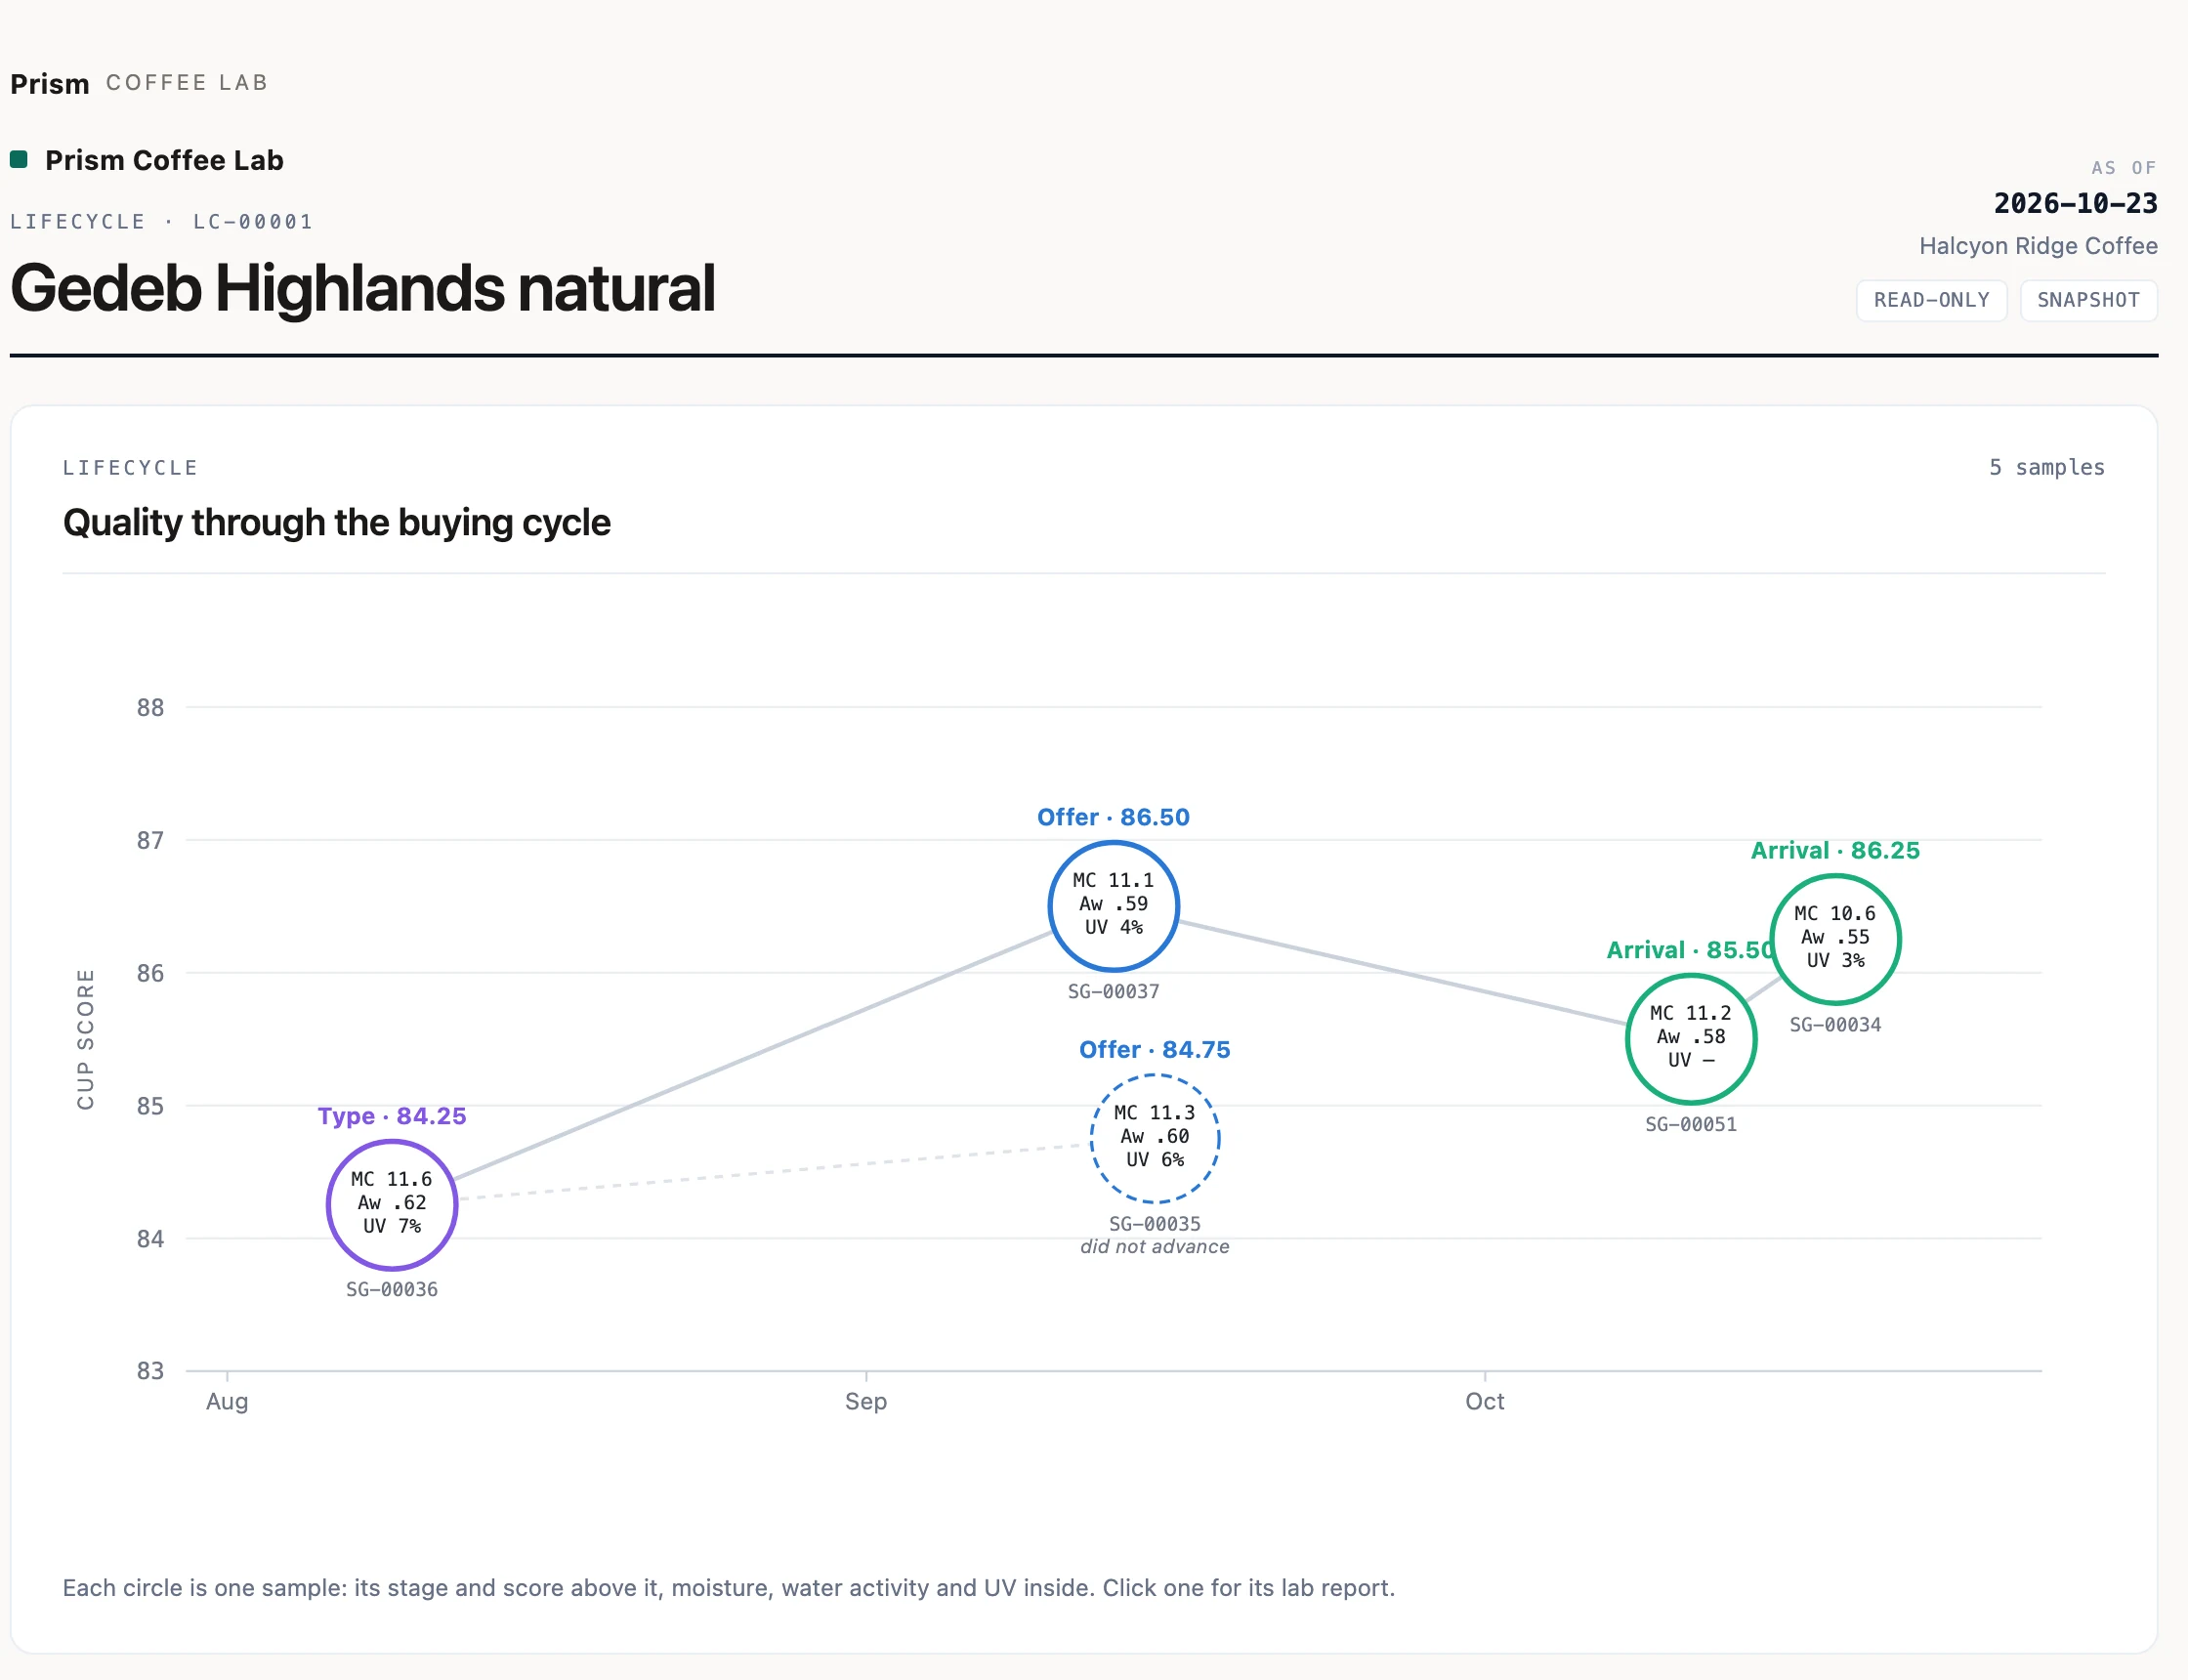
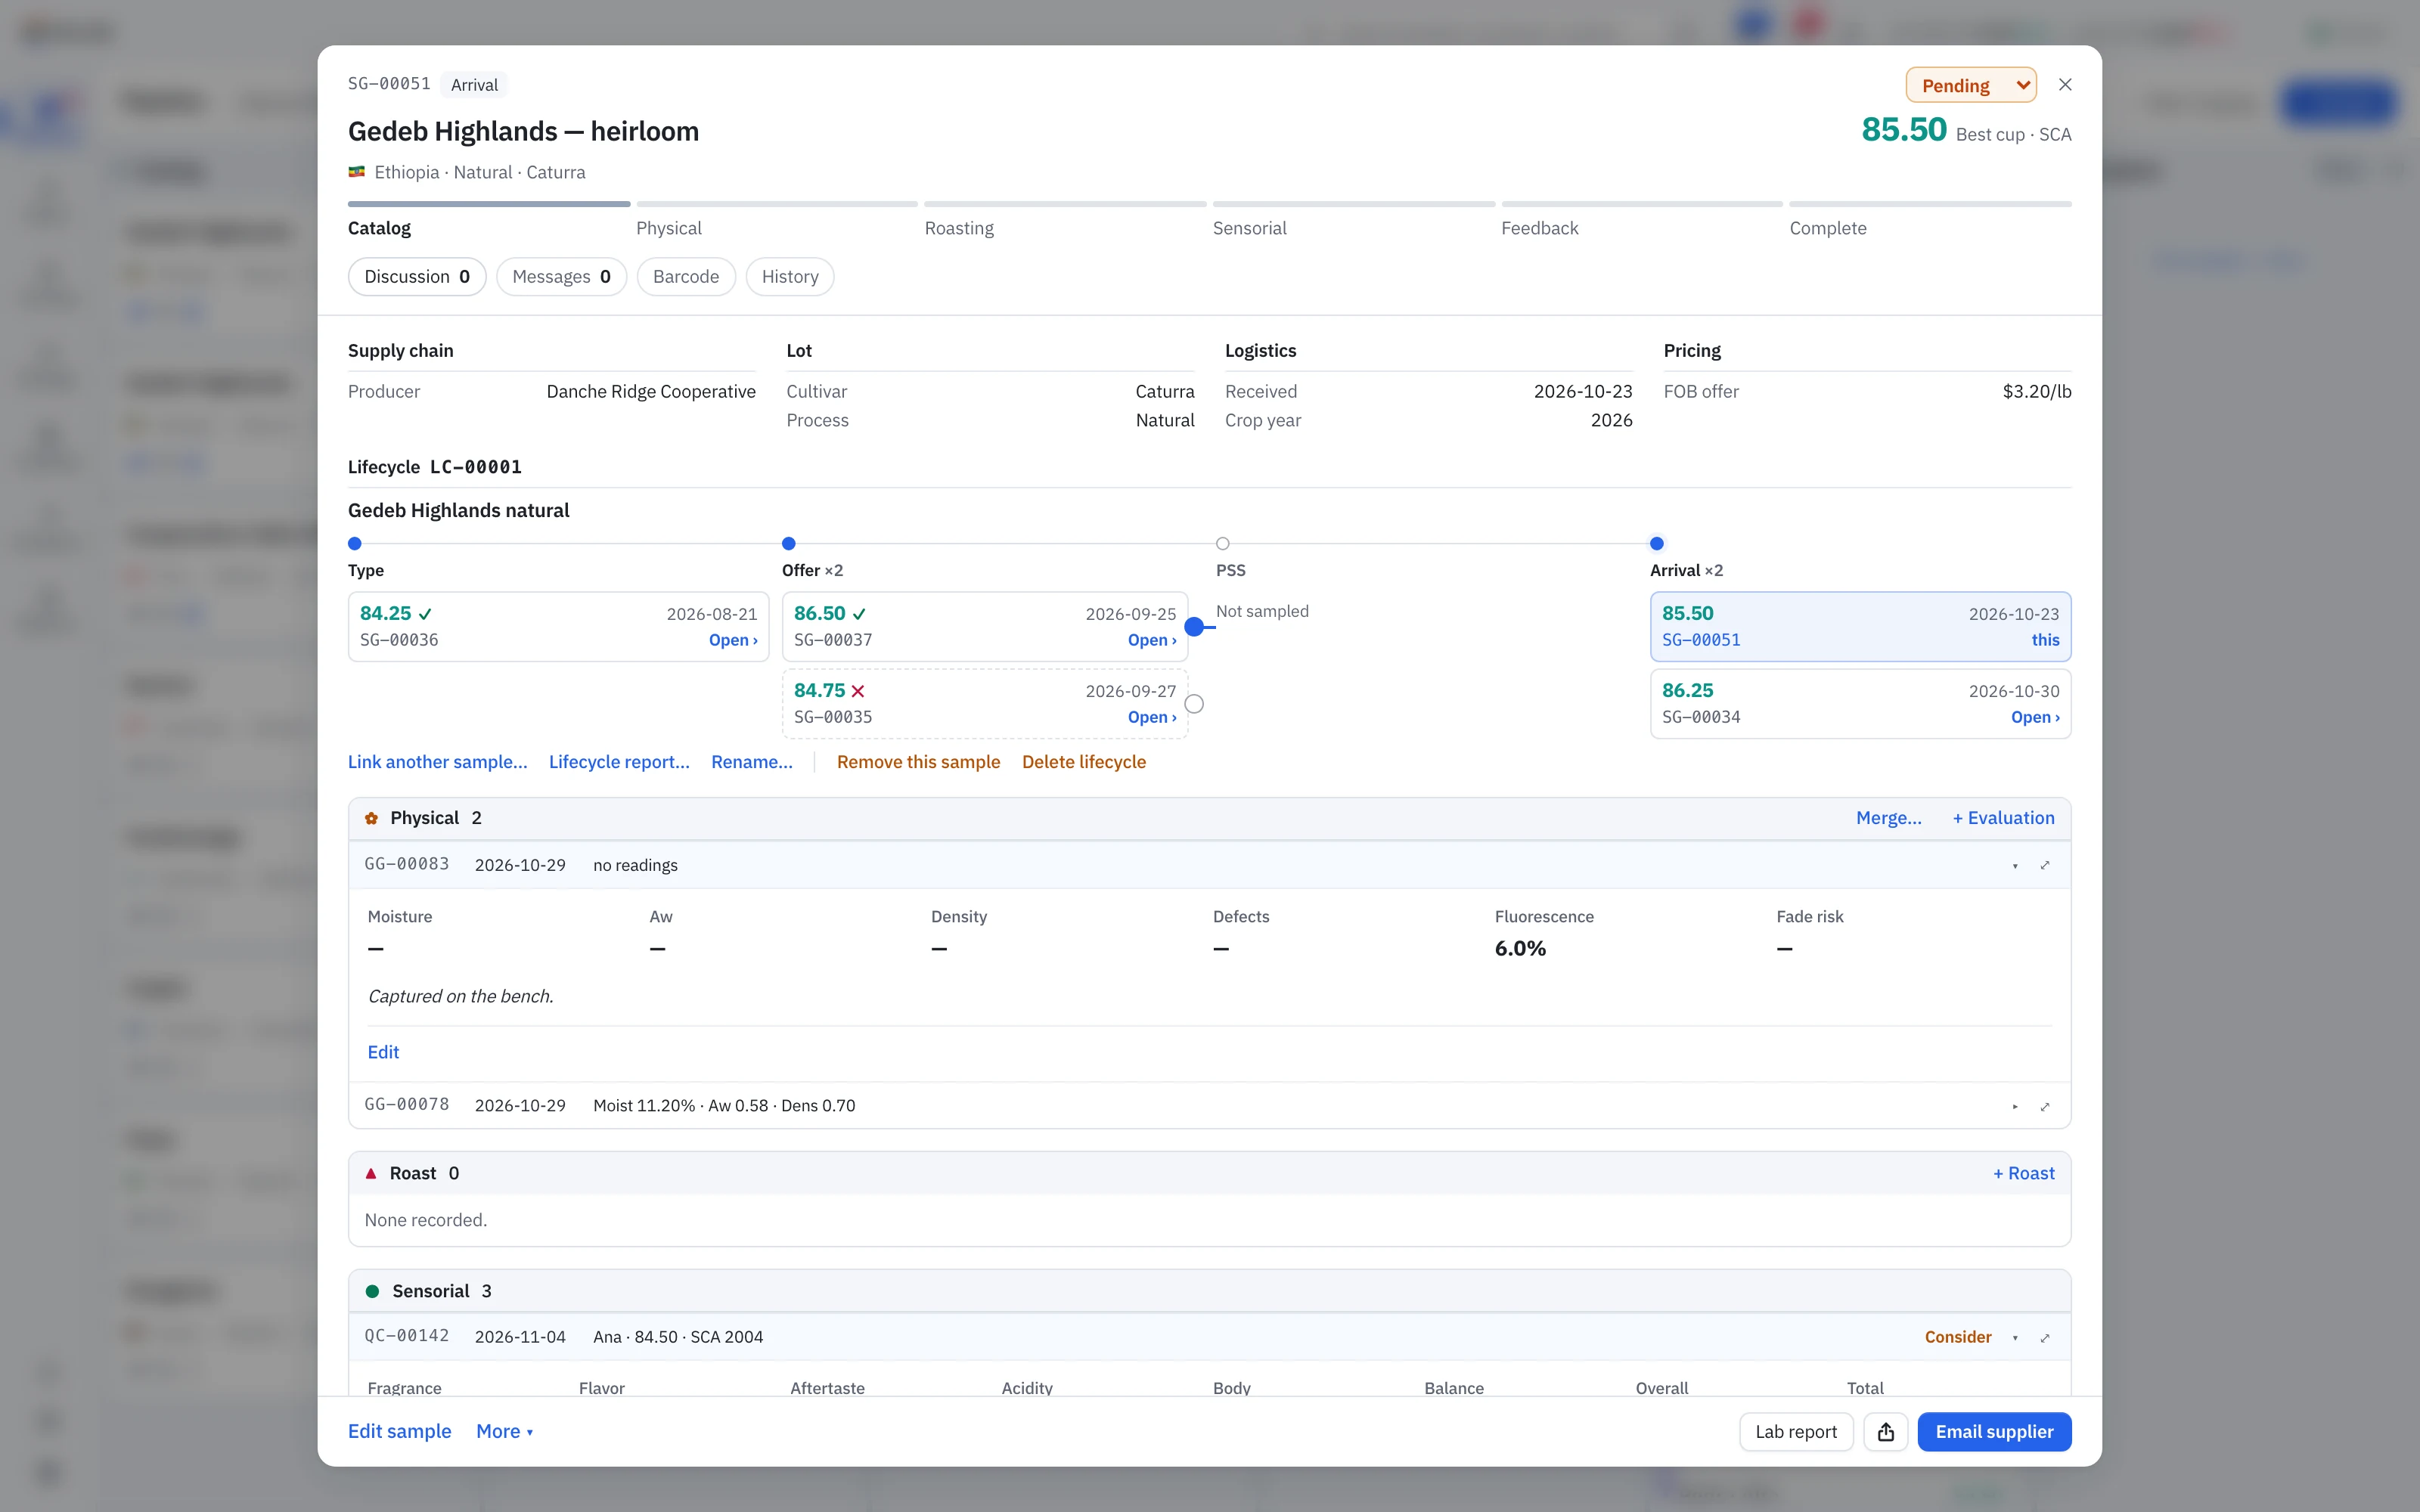
On every sample: the lifecycle lanes show the coffee’s other samples with their scores and dates; open any of them in one click.
Comparisons and sharing
Side by side, and safe to send
Put 2 to 36 samples side by side, build scorecards of your best lots, or send a read-only link.
- Comparisons of up to 36 samples
- Scorecards: shareable shortlists, ranked by panel score
- Links with a label and an expiry, revoked in one click
- QR codes on reports that open the shared page
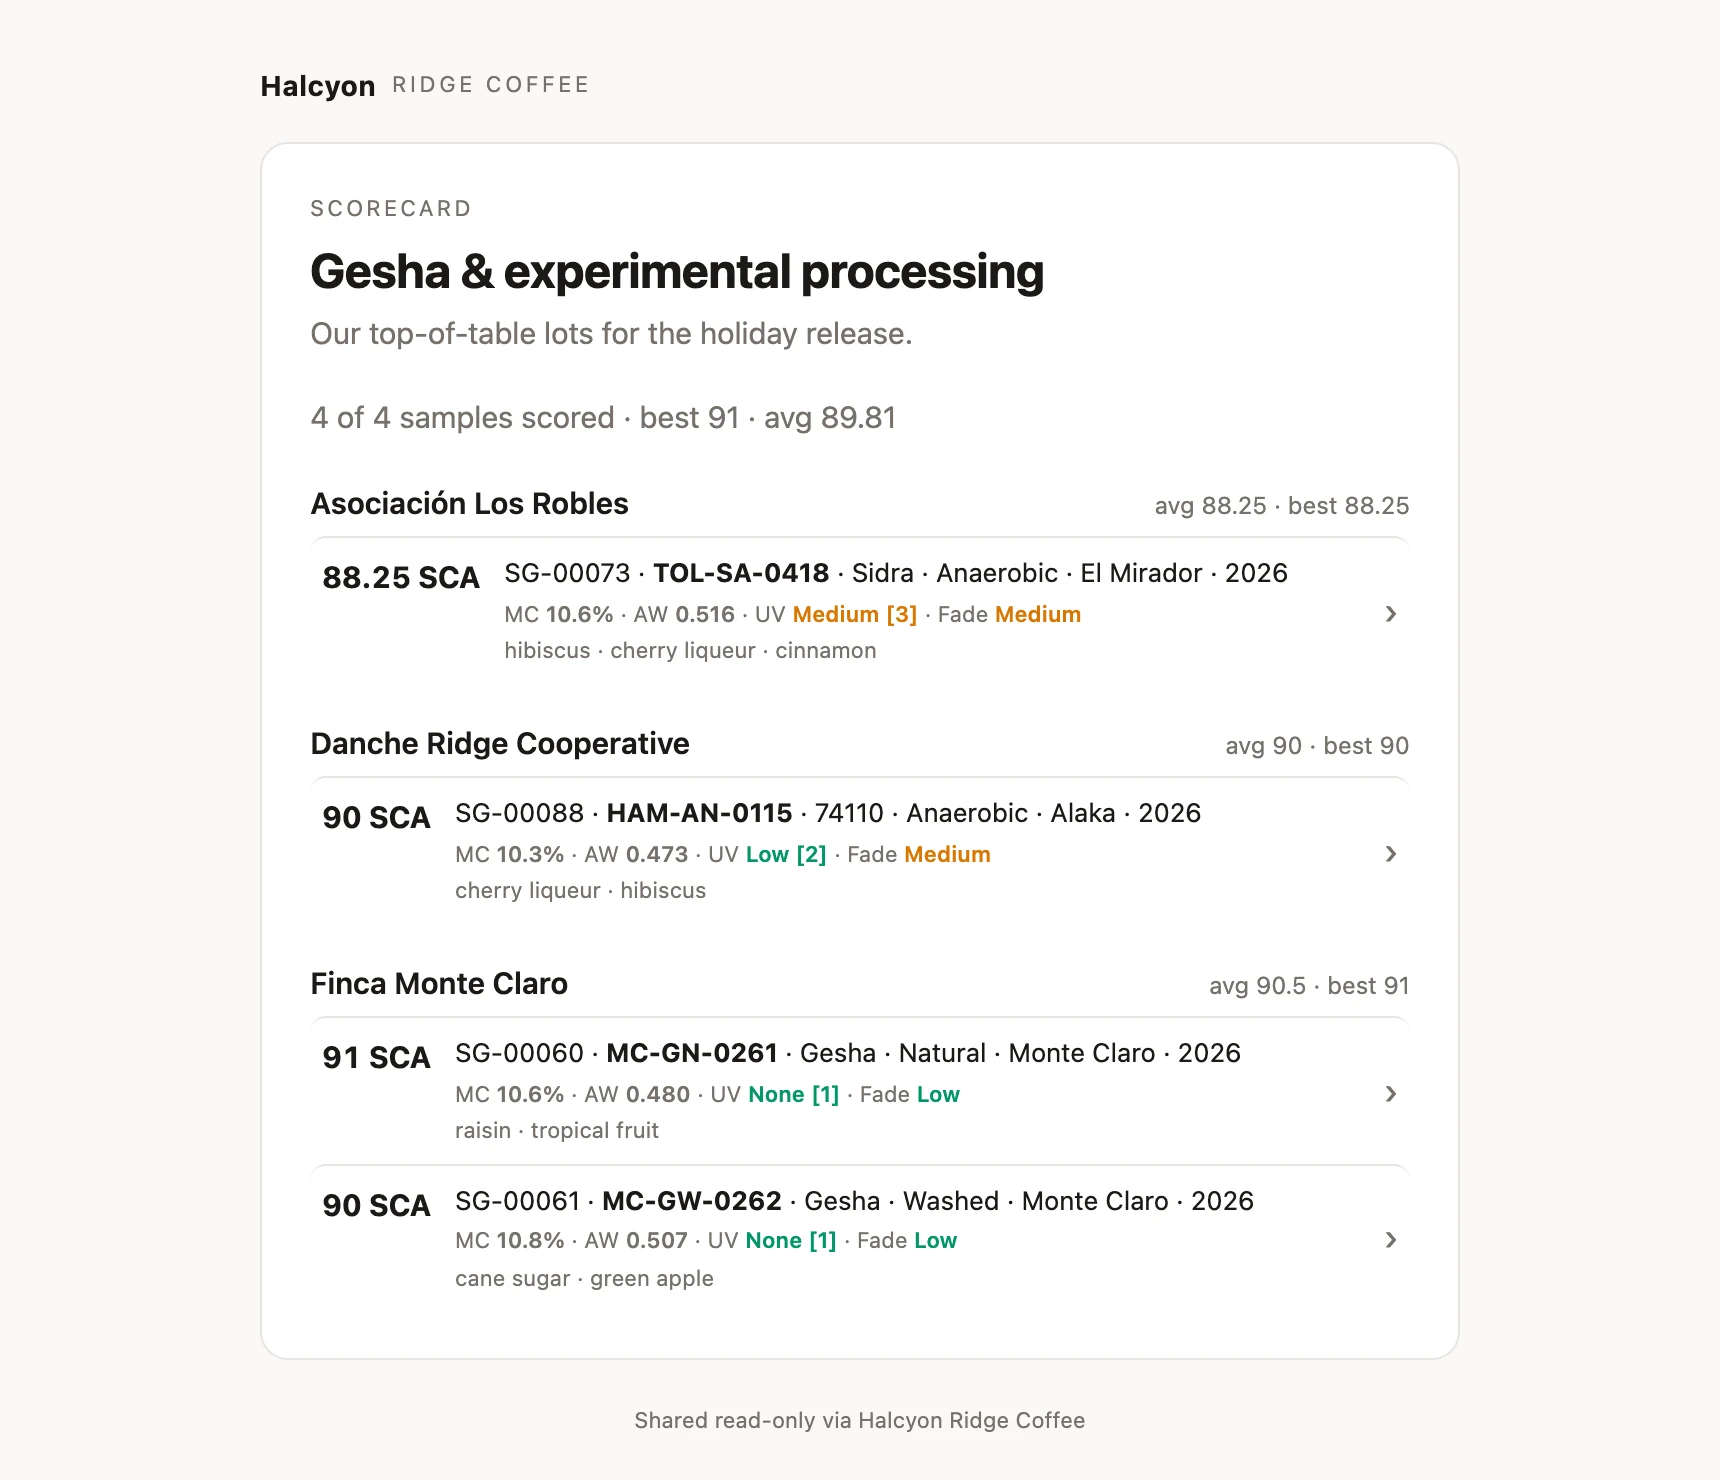
Scorecard: a shortlist you can send. Every coffee with its score, offer, farm, physical readings and flavor notes, and each opens its full lab report.
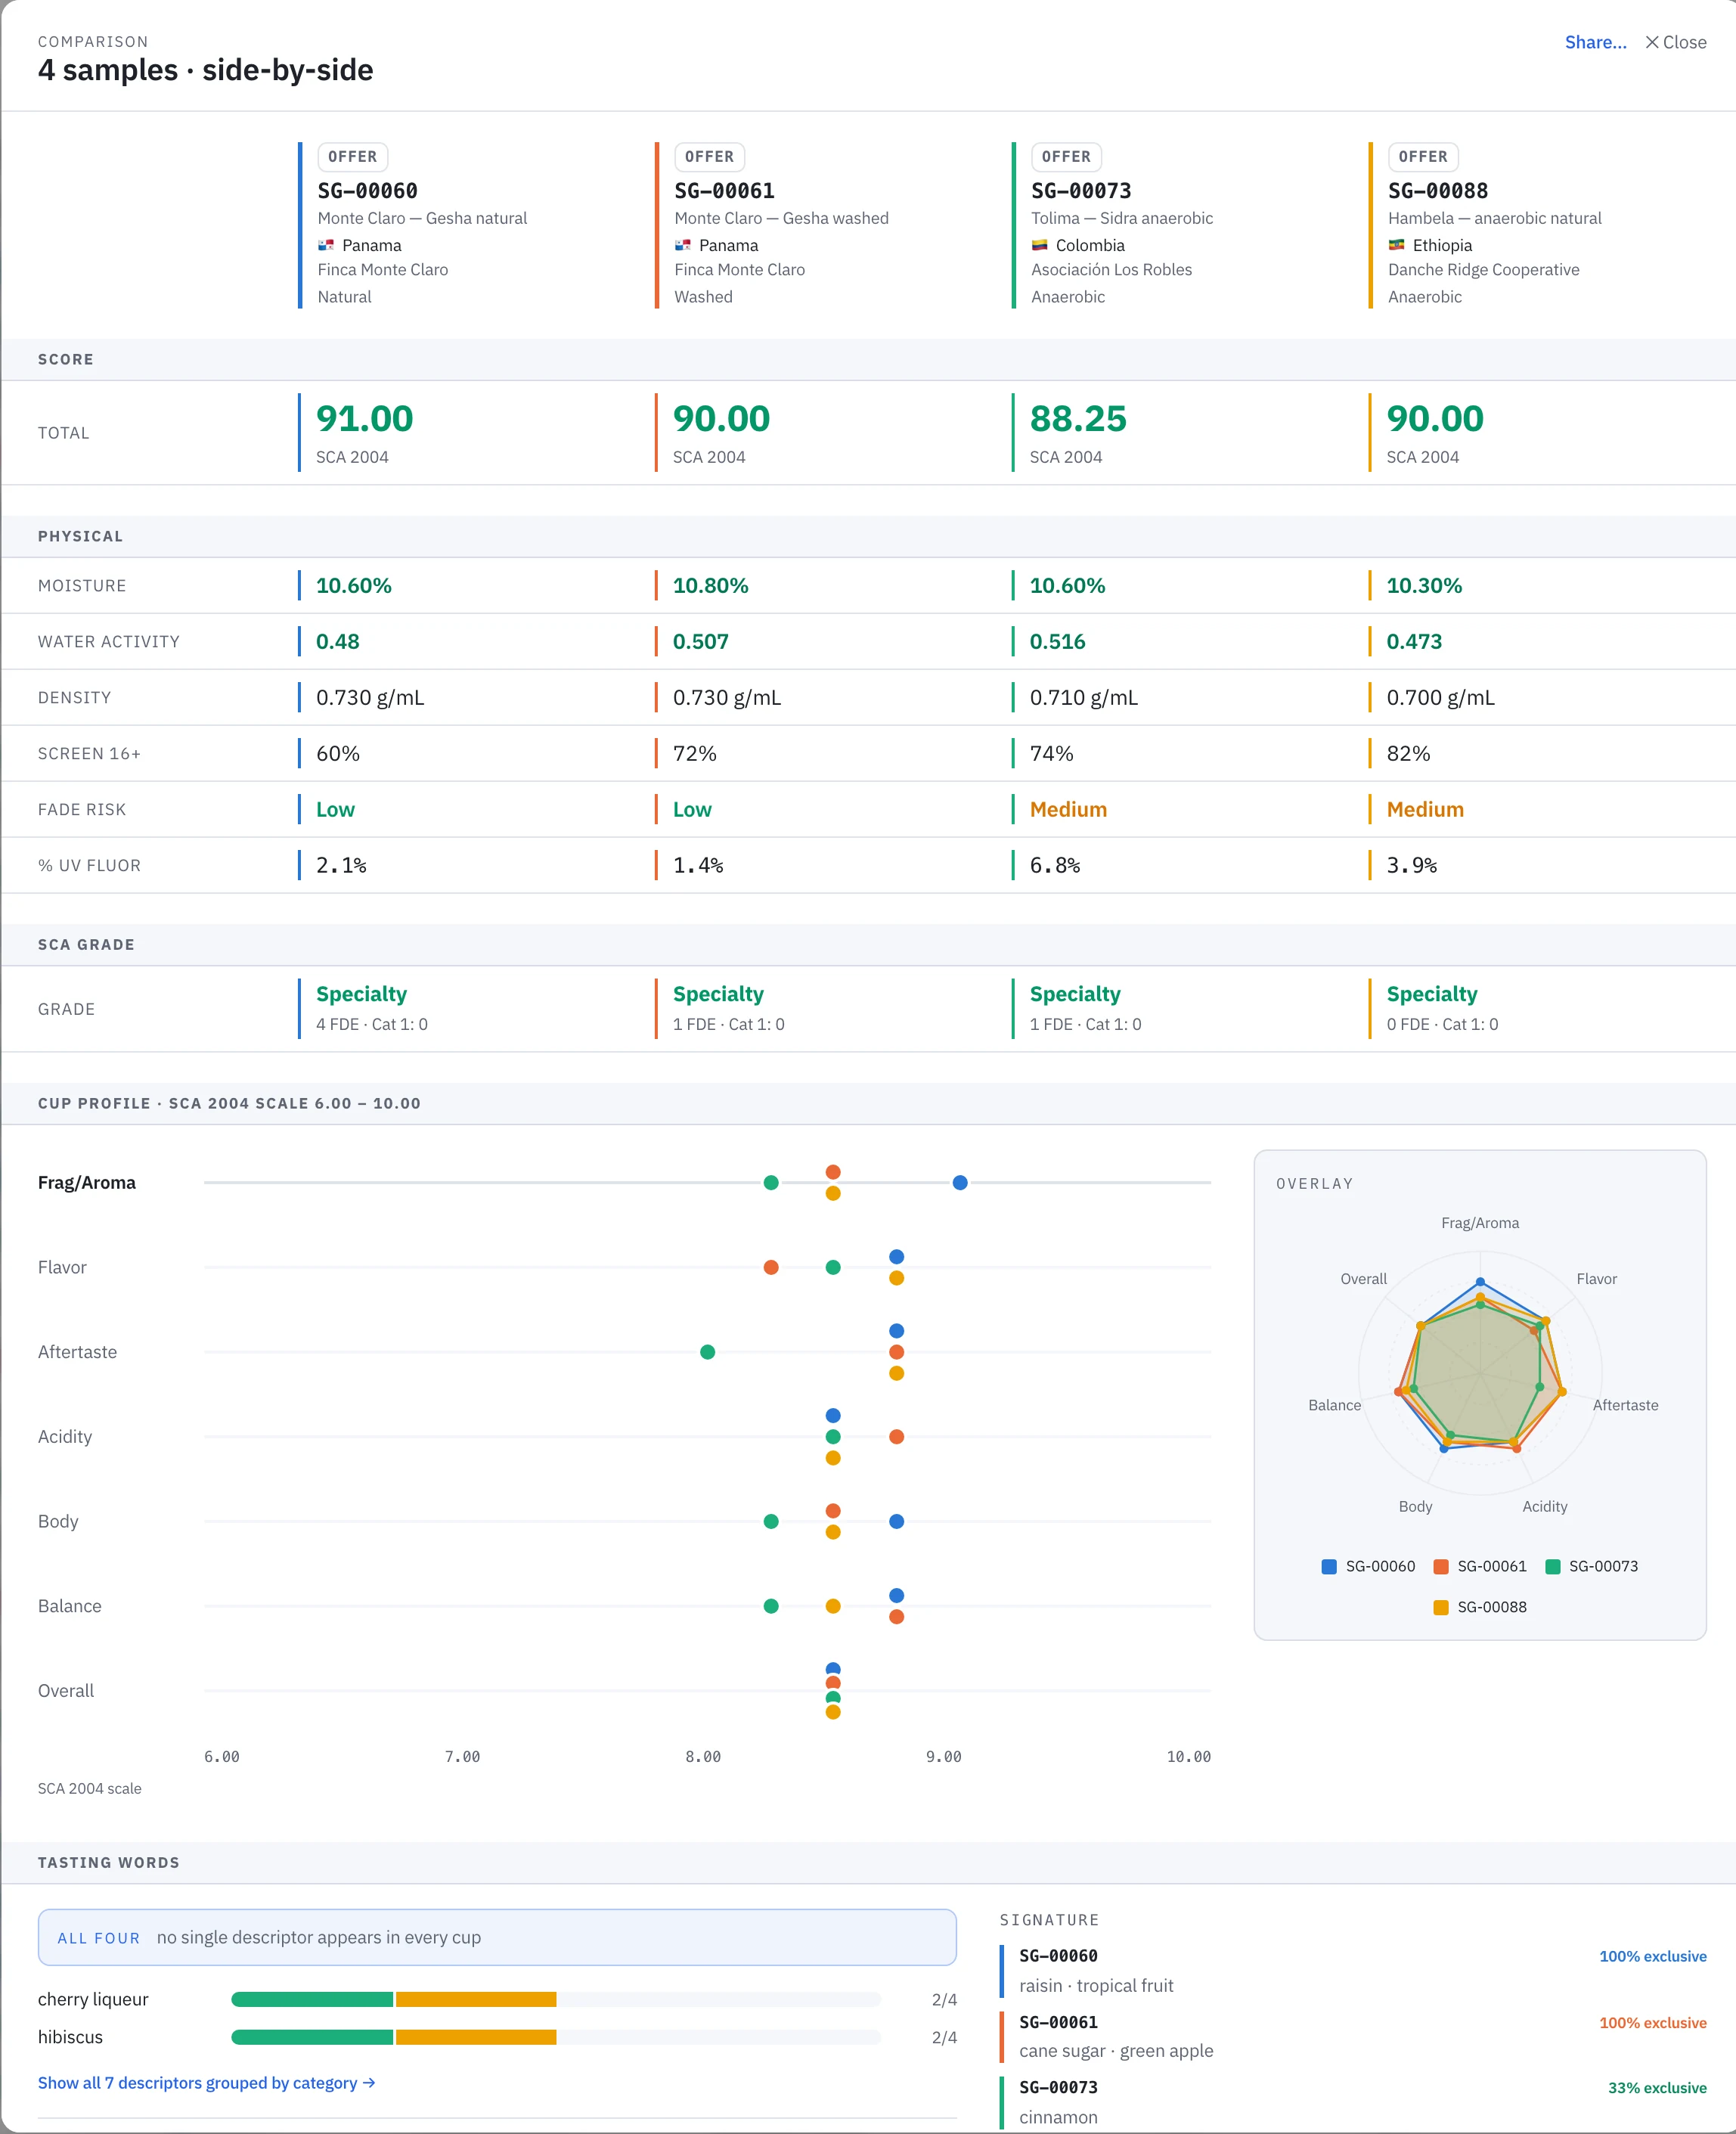
Compare: the same four coffees side by side. Physical readings, grade, every cupping attribute on one scale, and the tasting words they share.
Collaboration
Talk about the coffee where the coffee is
Every sample carries its own discussion. Start a thread on the record, @mention a teammate to pull them in, reply, and resolve it with a note when it’s settled. The conversation stays with the sample instead of getting lost in email or chat.
- Threads on every sample, open and resolved
- @mention a teammate to notify them
- Resolve with a note; resolved threads fold away but keep their history
- Edits keep a visible history
- Supplier correspondence kept on the same record
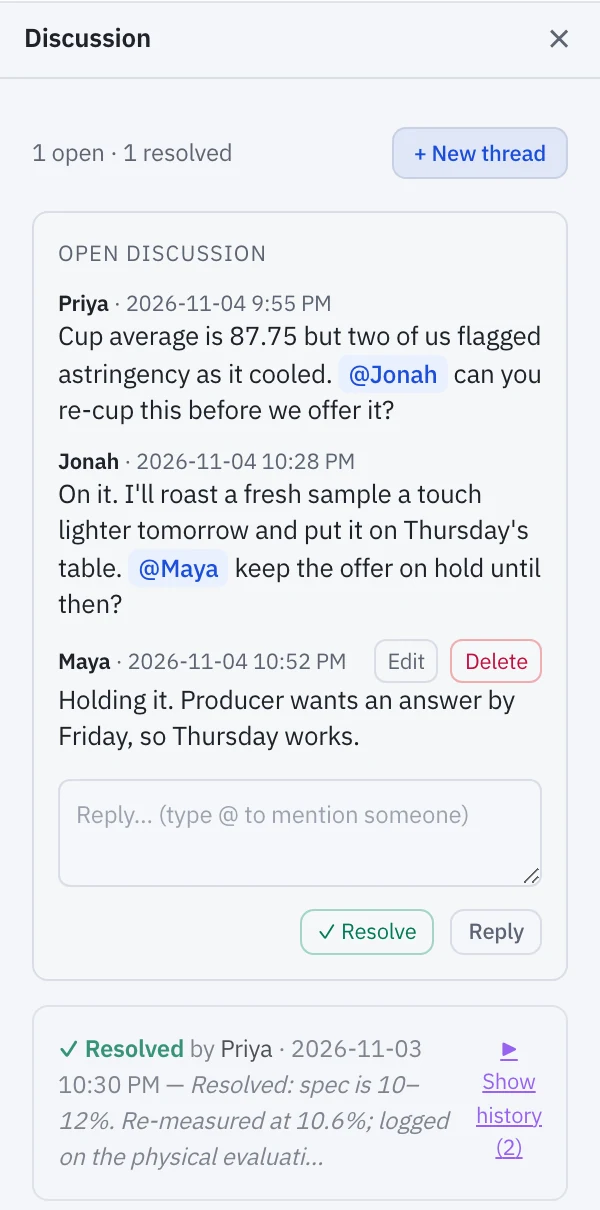
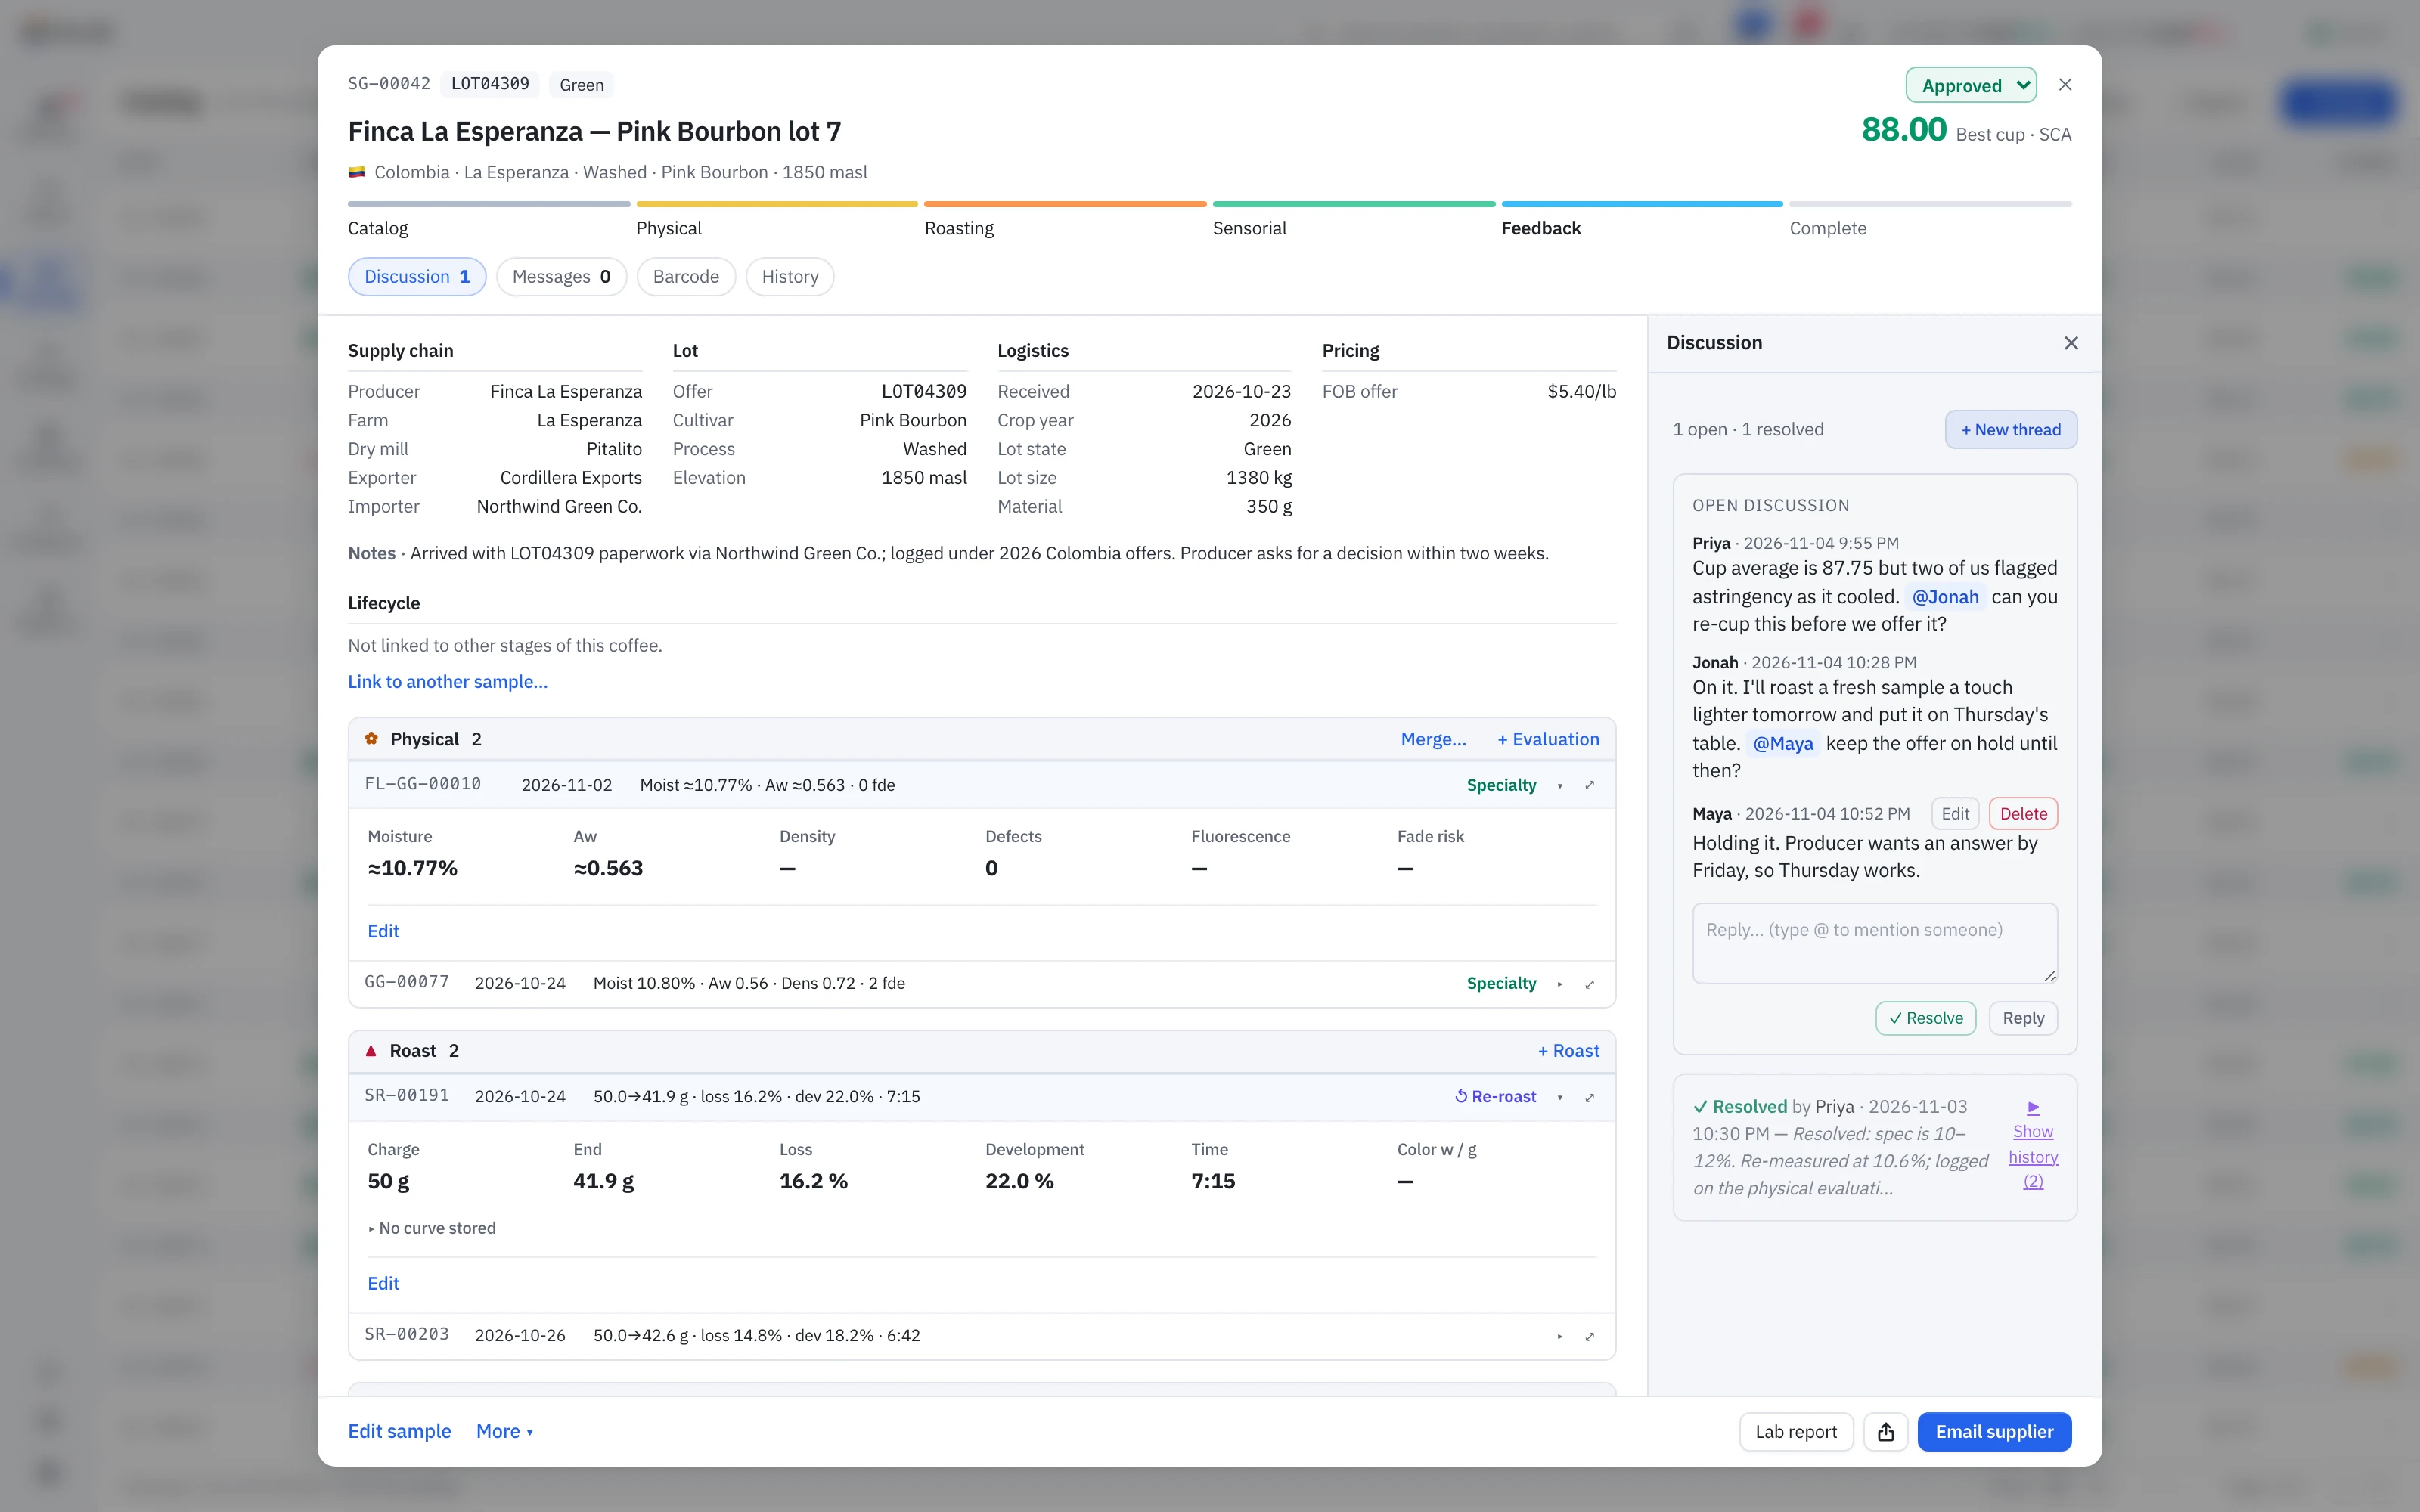
Beside the evidence: the discussion sits next to the sample’s grading, roasts and cupping scores, so a question and the numbers it is about are on one screen.
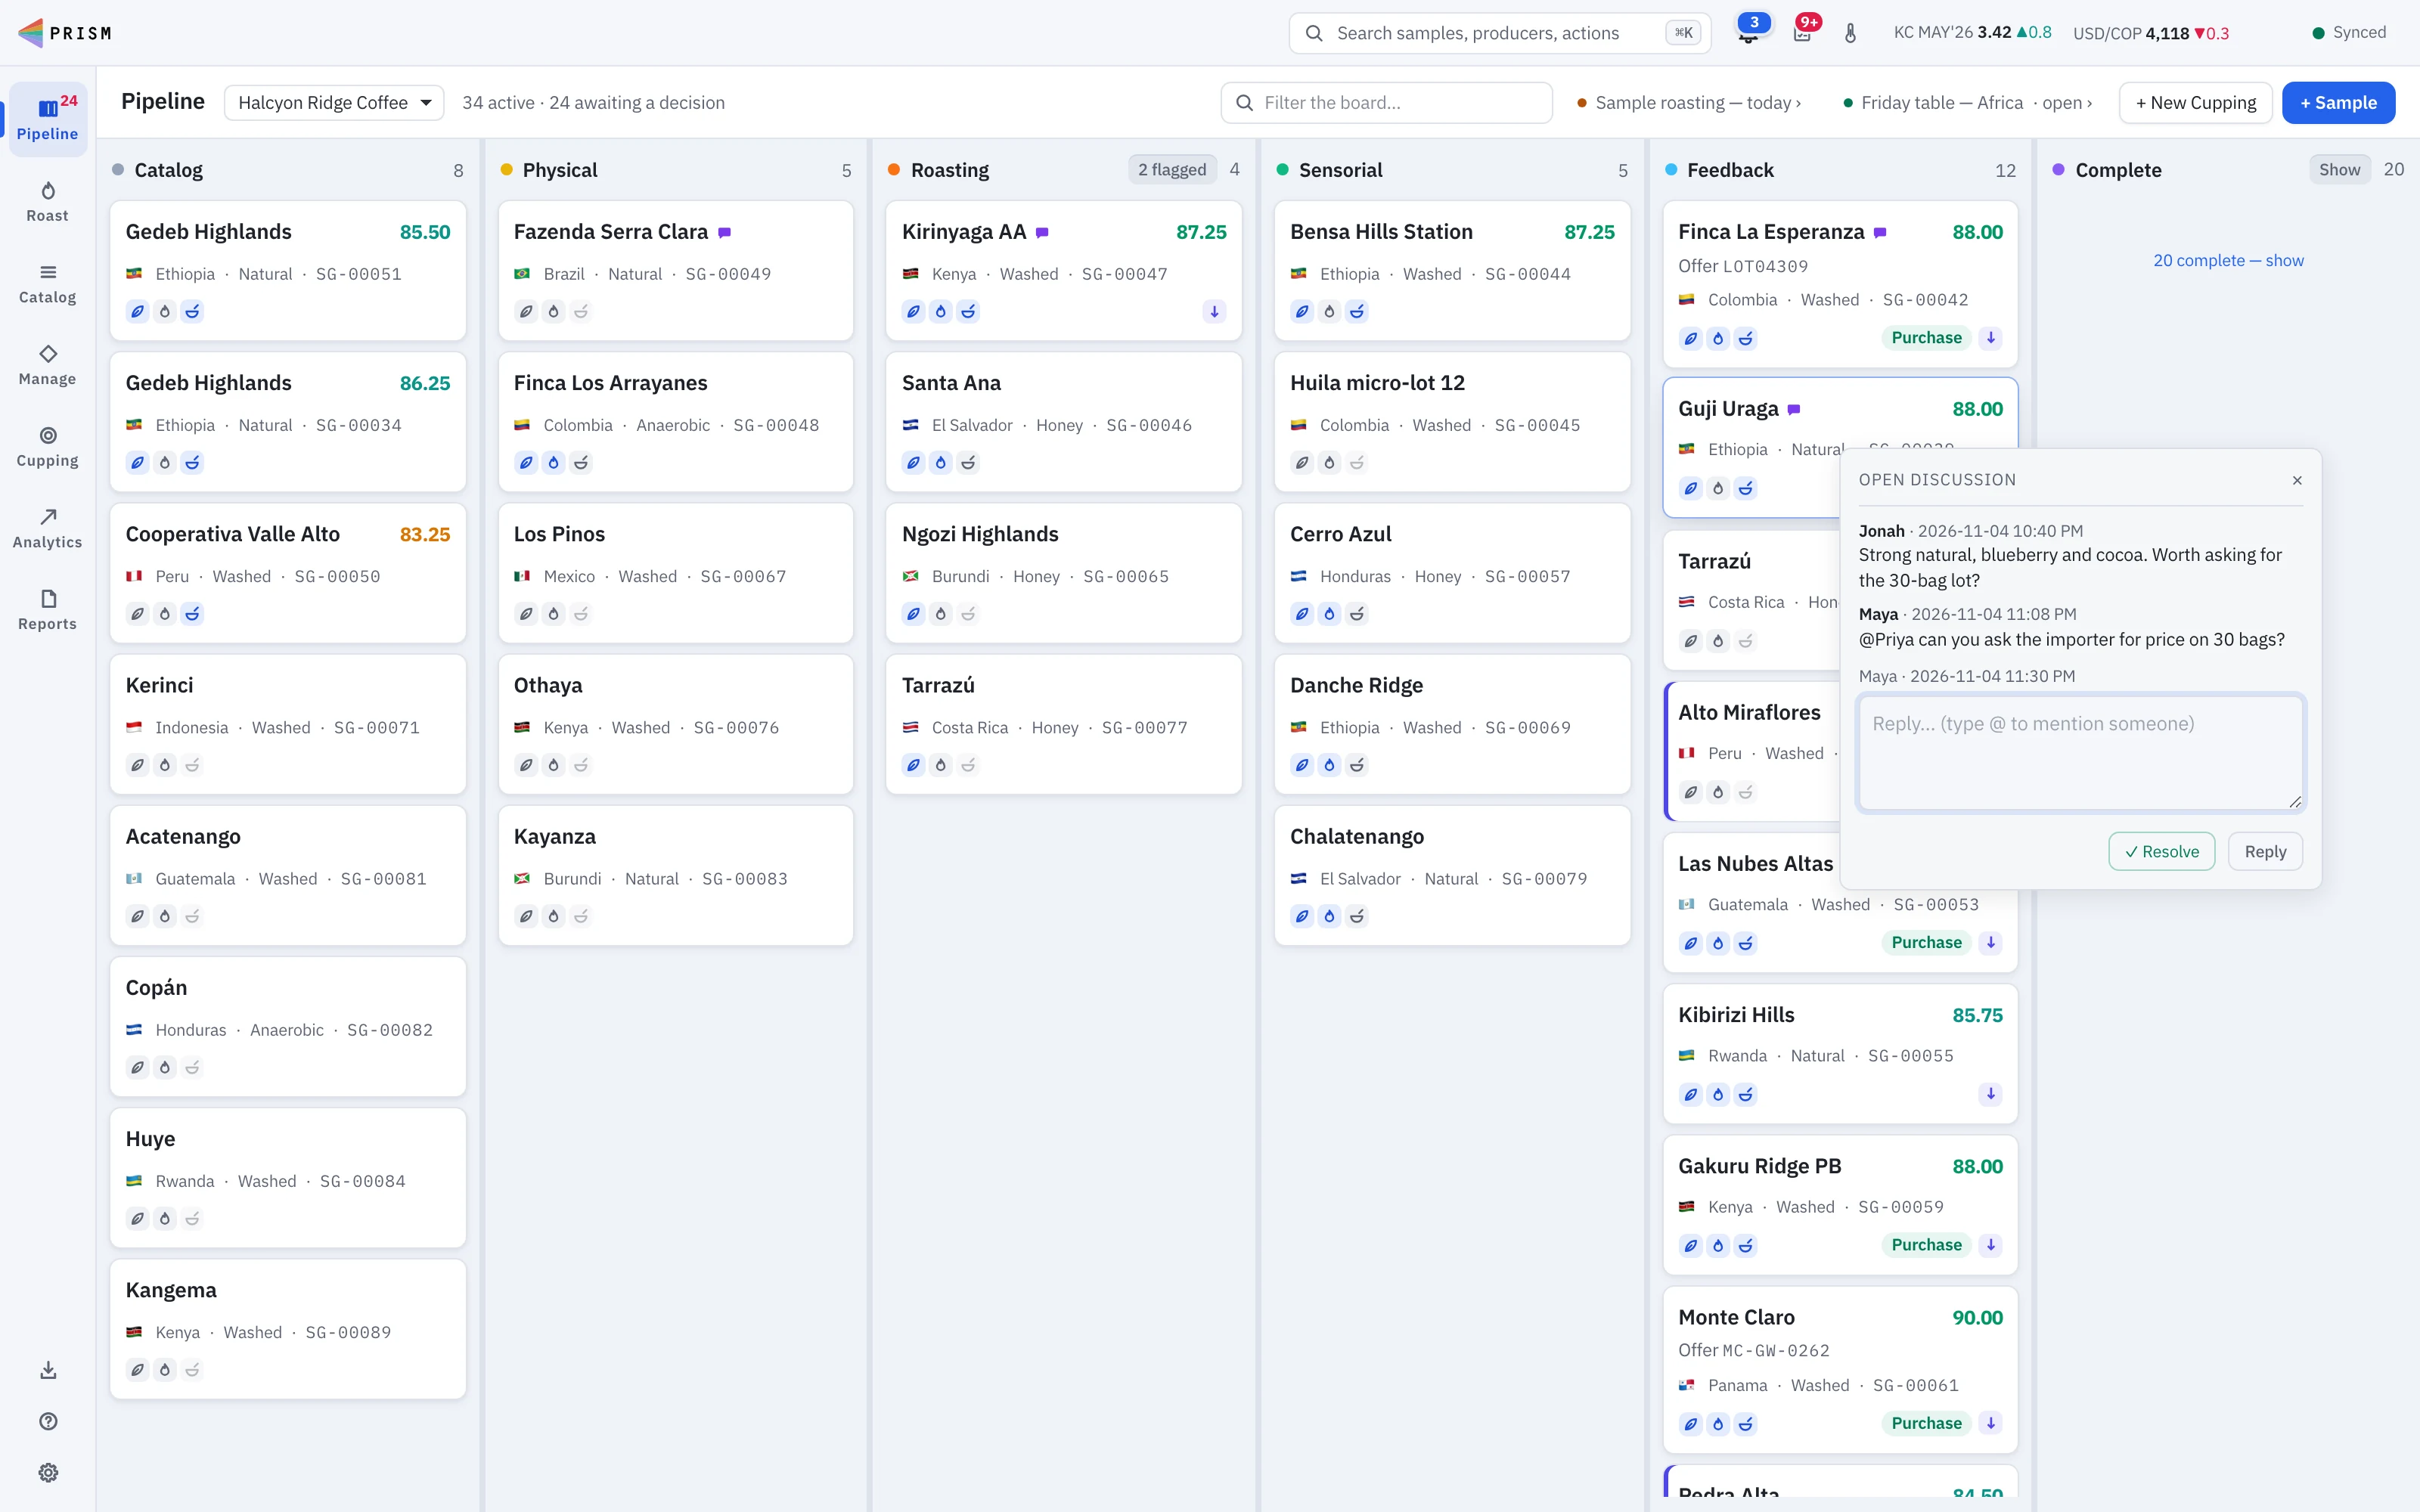
From the board: right-click a card to drop a quick note or answer a thread without leaving the pipeline.
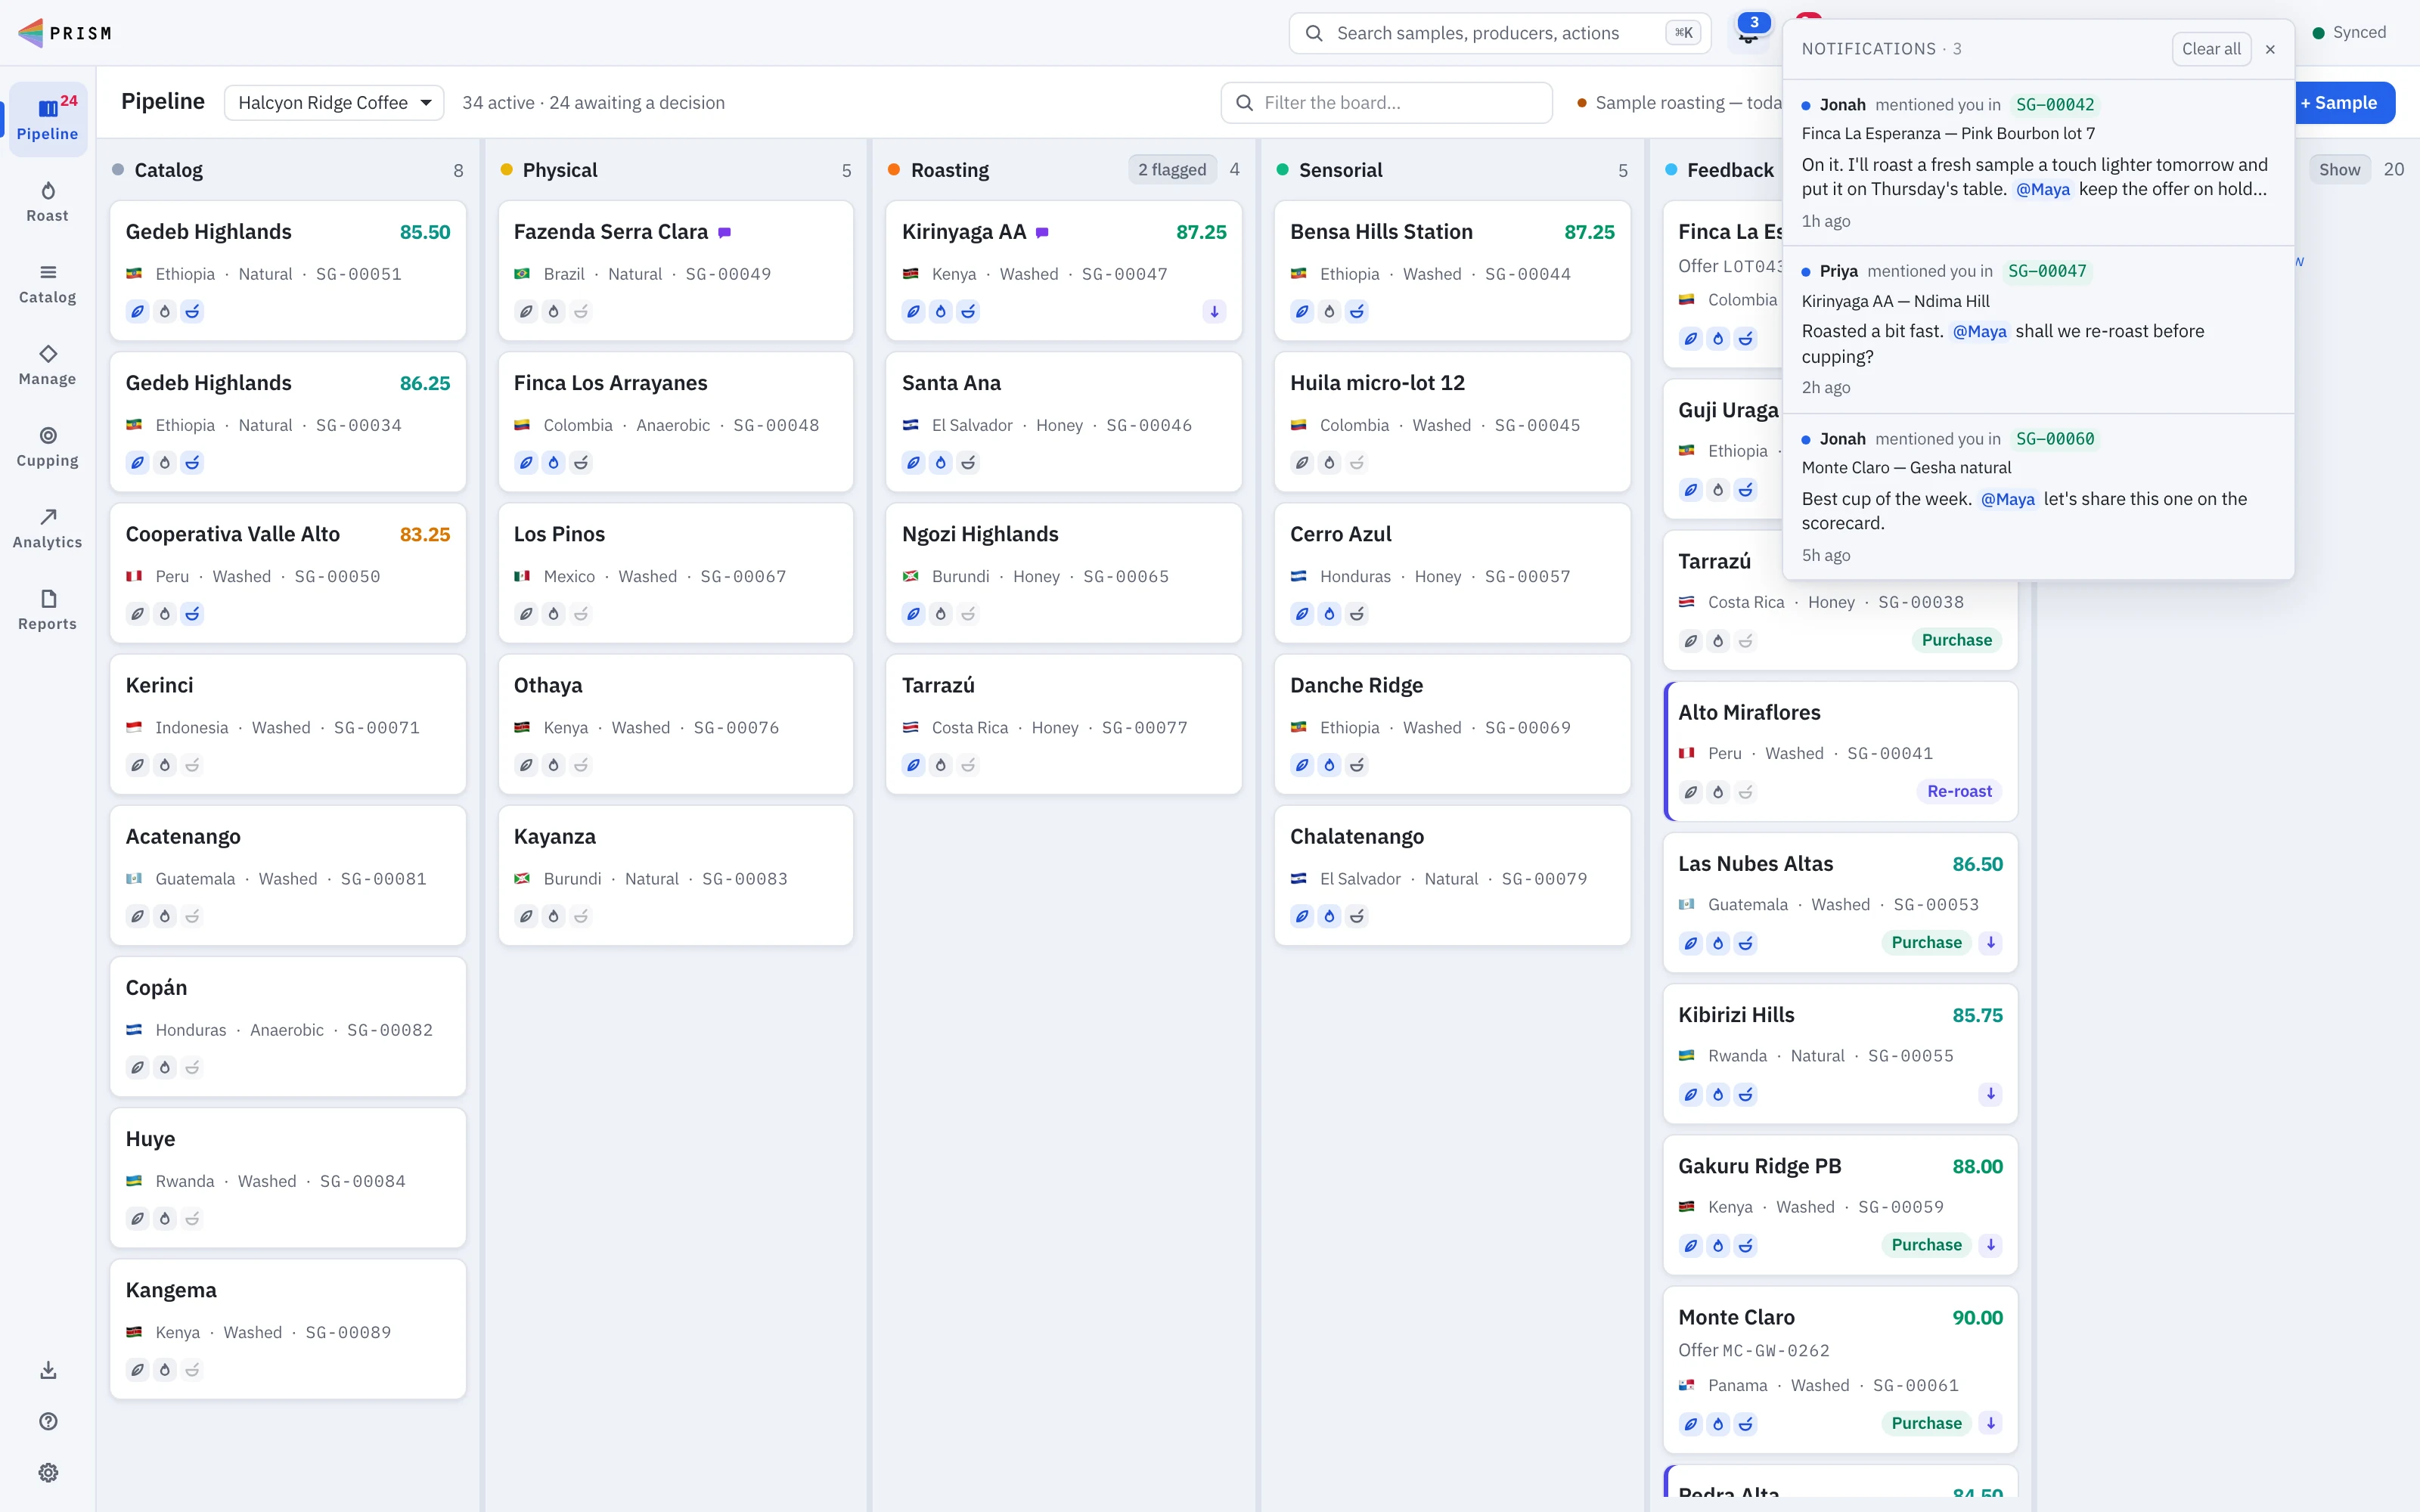
Notifications: when a teammate @mentions you, it lands in the bell, naming the coffee it’s about.
Everyone on the same samples
Changes appear for the whole team in real time, and every sample shows who did what, and when.
Tags and notes
Tag samples by project, buyer or anything else, and find them again by any tag from the catalog search.
Bring in outside cuppers
Guests score by invite link, with no account, and see only the session they were invited to.
Labs around the world
Link your labs, wherever they are
Run Prism at origin, in the export office and at the roastery, and link the labs by invite: a QR code, a code or an email. You choose what flows each way: everything, nothing, or only the samples from a project, a country or a tag. Shared samples arrive with their evaluations as read-only copies, producers and cultivars become one shared directory, and every lab’s board is a click away, even while the other lab is offline.
- Invite another lab by QR code, code or email
- Share everything, nothing, or only by project, country or tag
- Every lab’s board in one view; other labs’ cards read-only
- One shared directory of producers, importers, exporters and cultivars
- Each lab keeps its own server, its own units and its own license
- Signed, server-to-server sync between labs
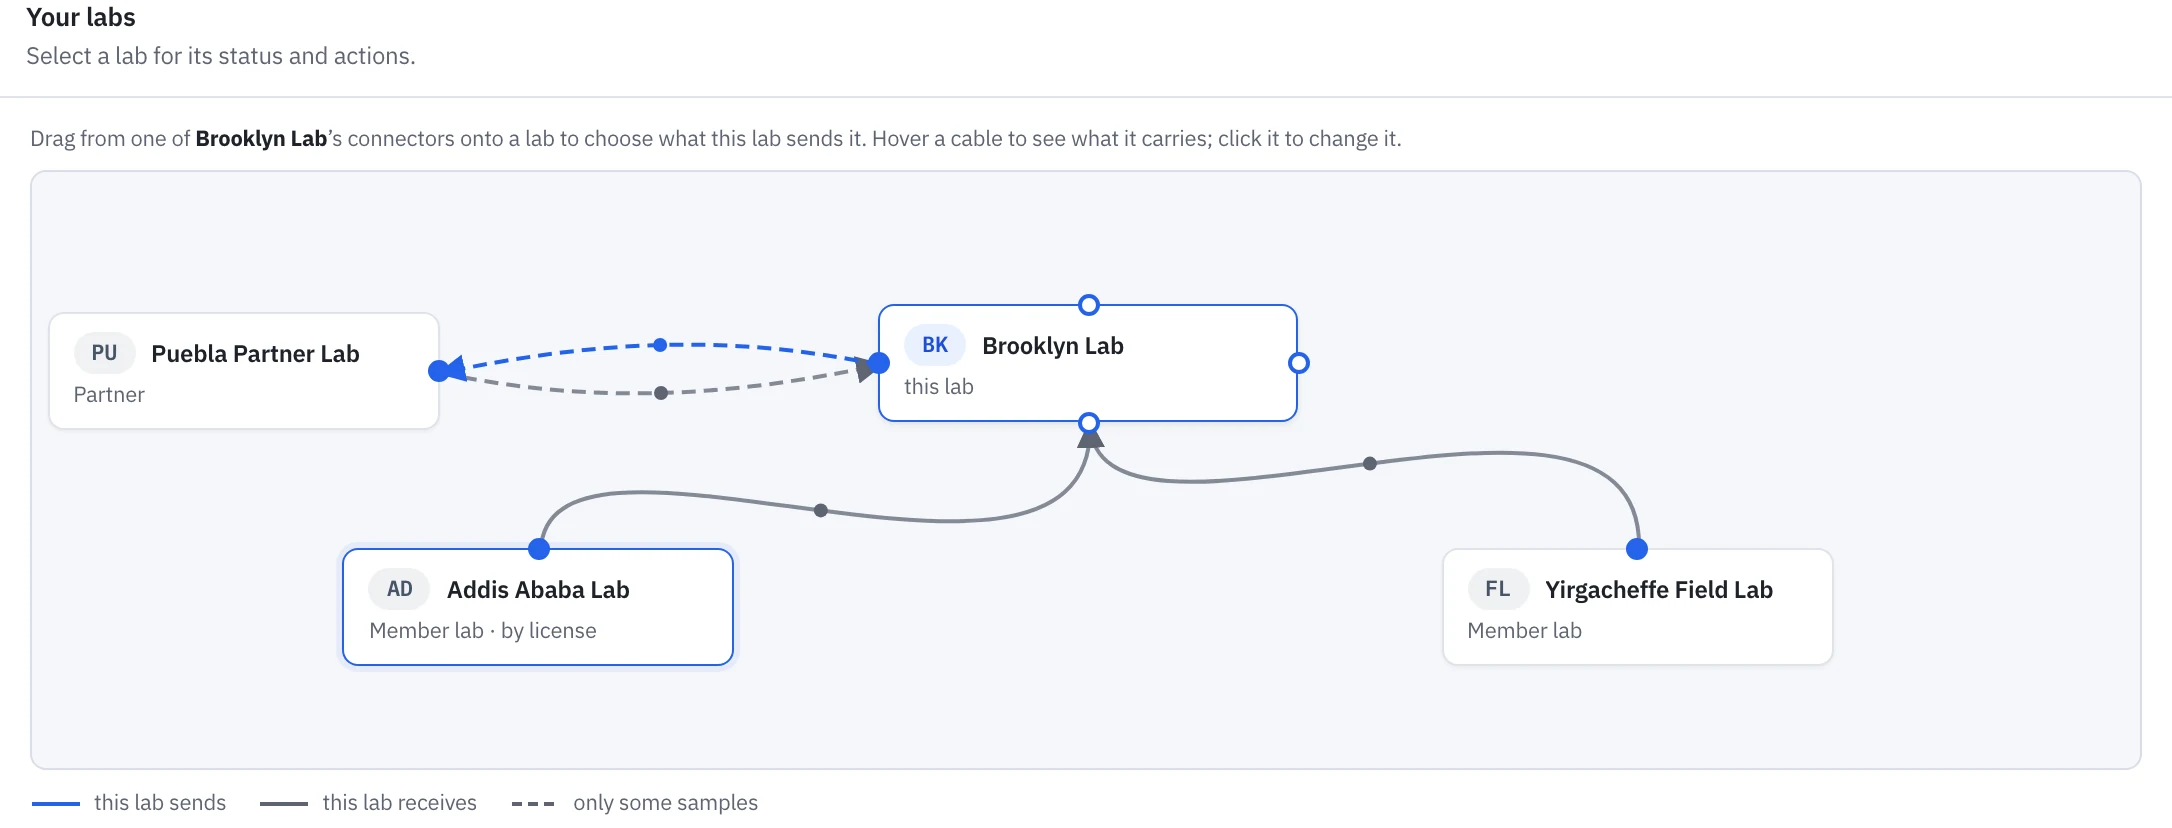
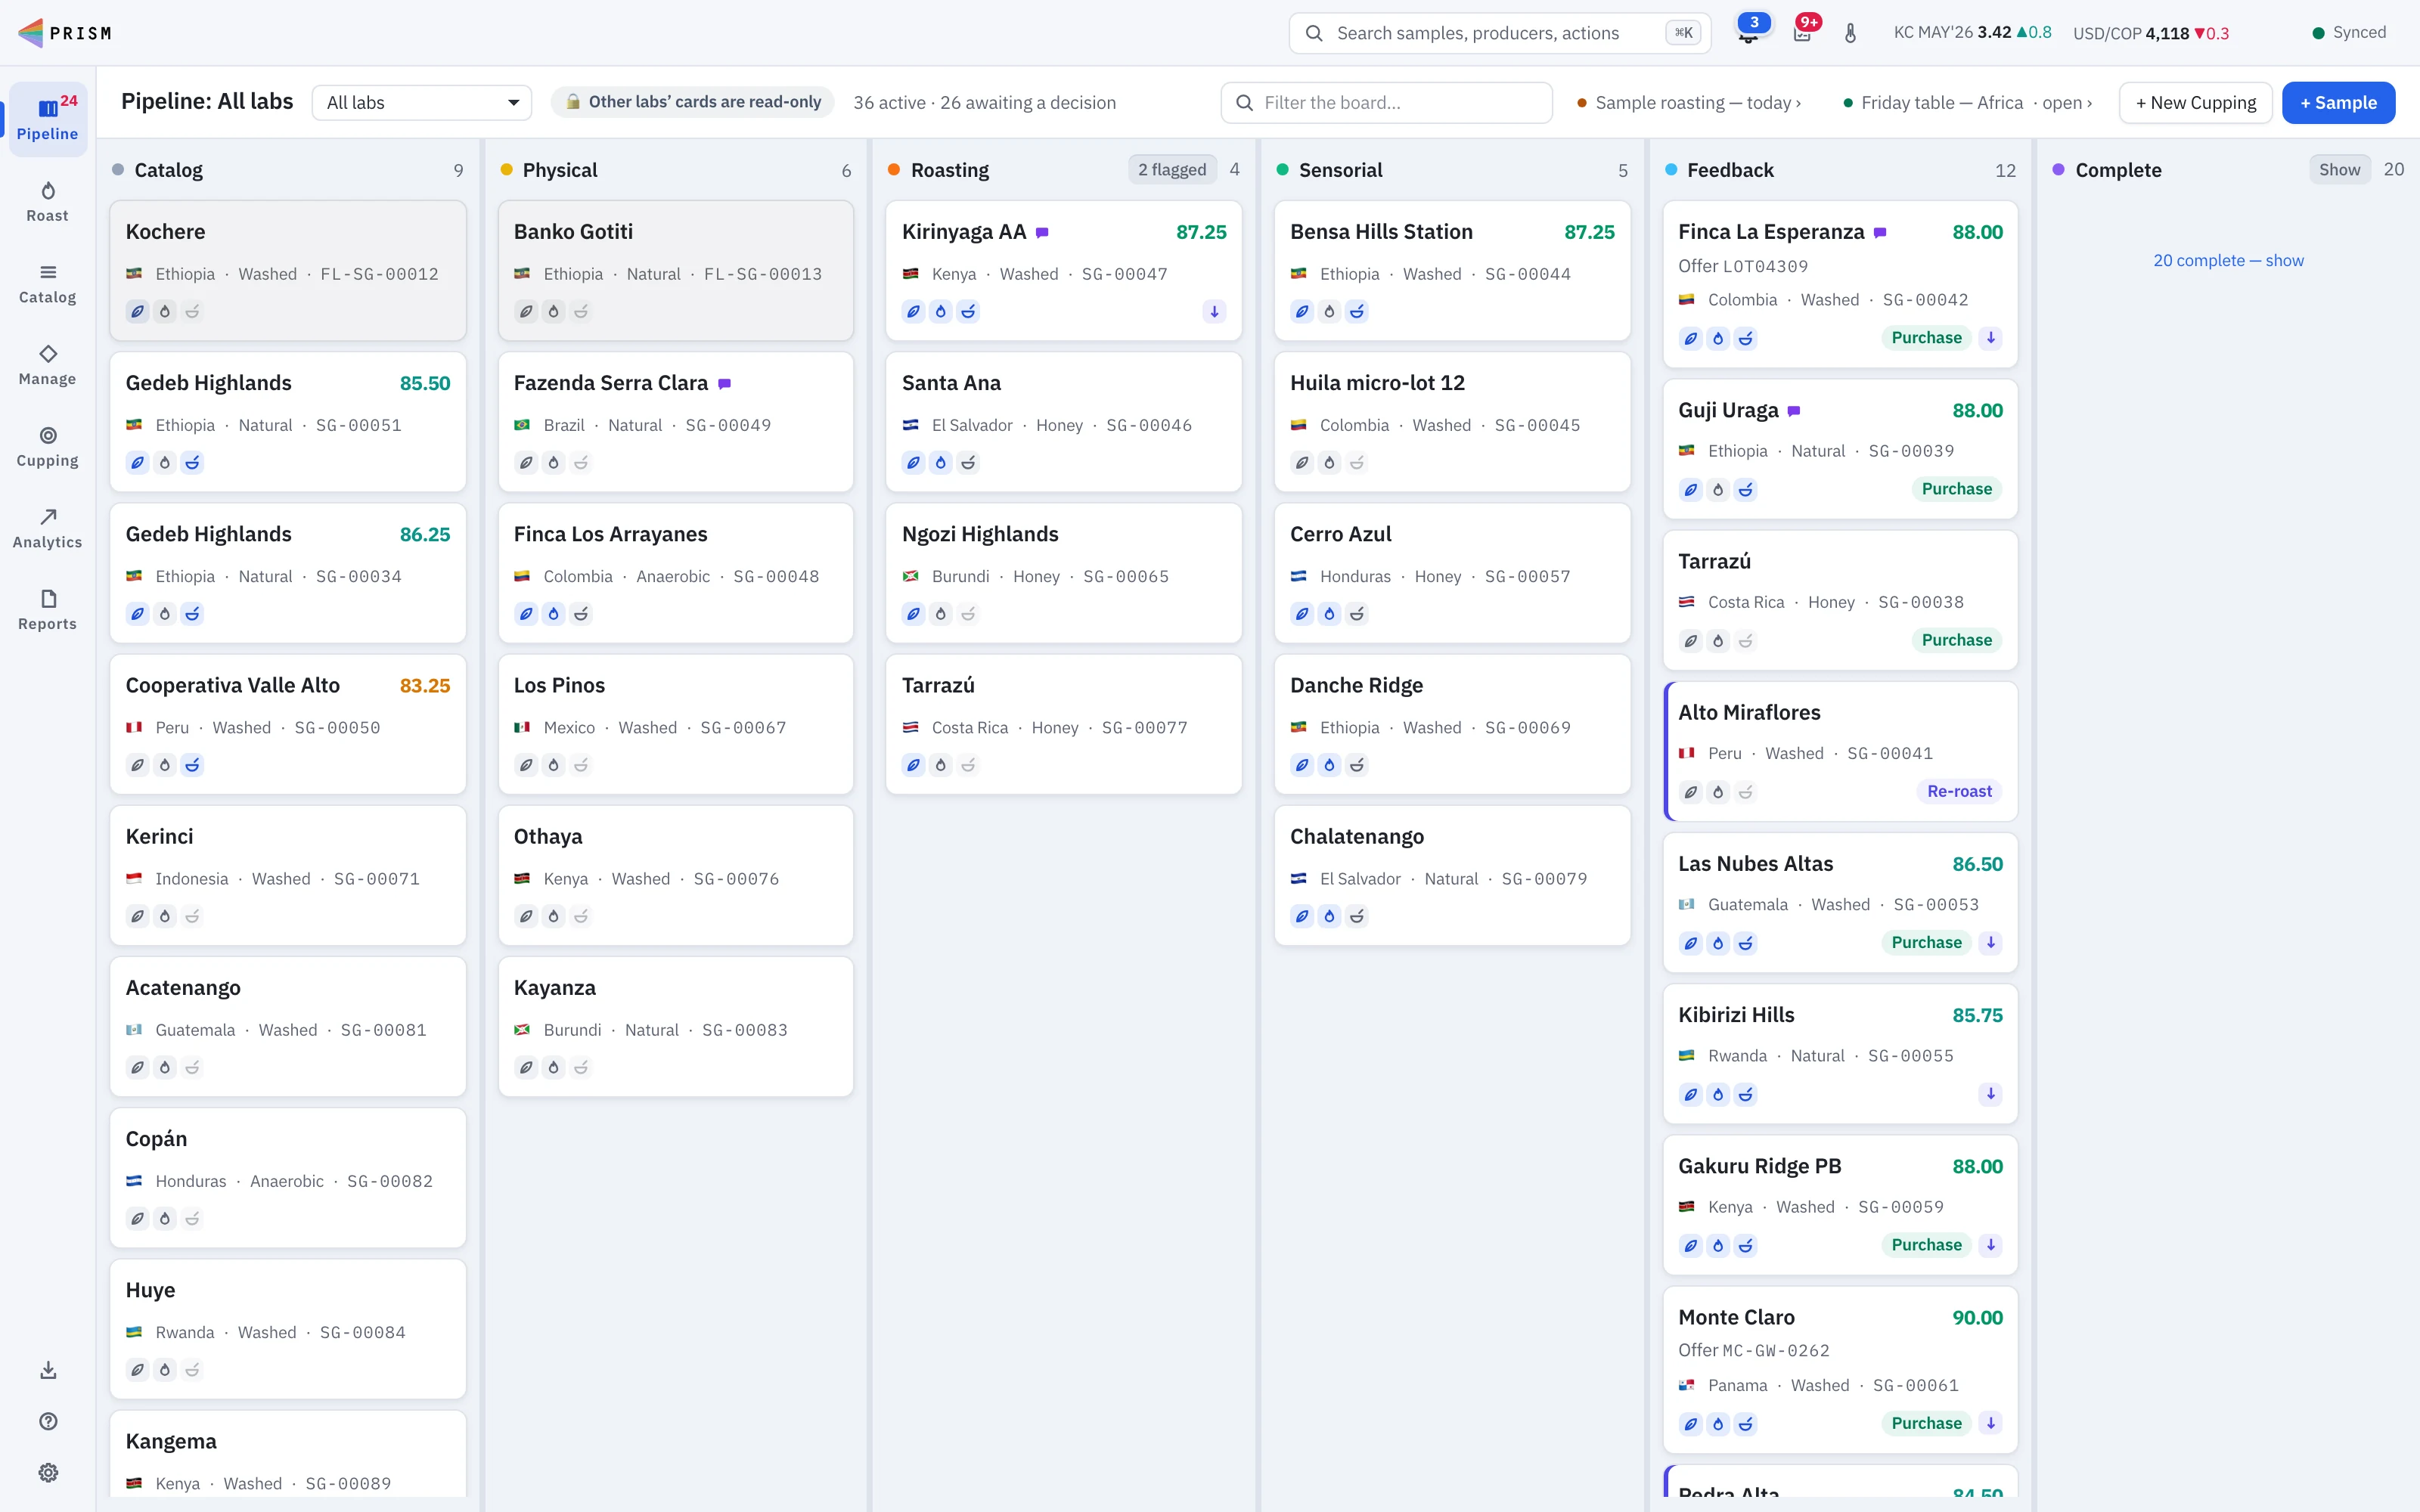
Every lab’s board: switch the pipeline to another lab, or to all of them at once. Their cards open but never move; only the lab that owns a sample changes it.
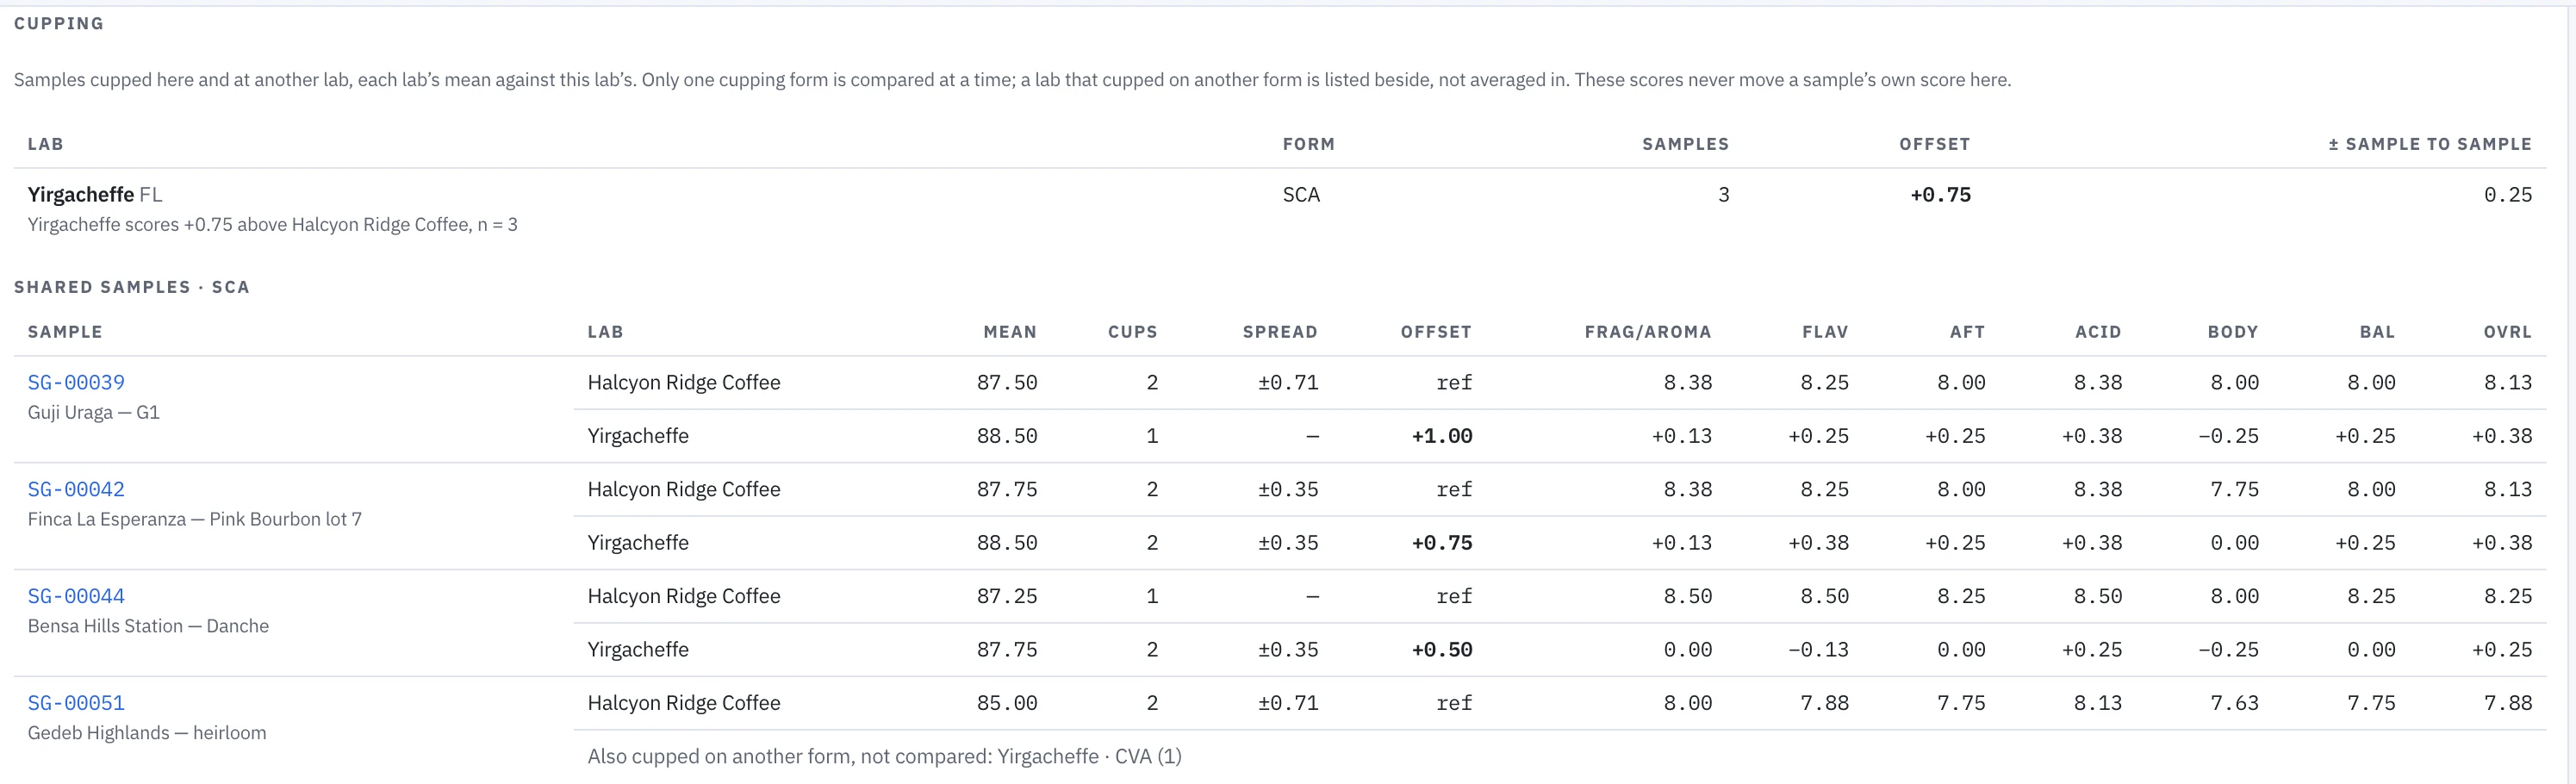
Calibration across labs: tag a sample for calibration and it goes to your member labs blind. Their scores come back, and Prism shows how far each lab and each cupper sits from yours, without letting another lab’s score change your own.
Analytics
A dashboard you arrange, and questions you can ask
Samples, mean score, approval rate, roast loss and days from intake to decision, then the funnel, score distribution, scores by origin, moisture against water activity and price against quality. Move and resize every tile, and the layout is shared with the team.
- Figures that show a dash, never a misleading zero
- A funnel counted against everything received
- Moisture against water activity, with your own trend line
- Price against quality for every coffee you have priced
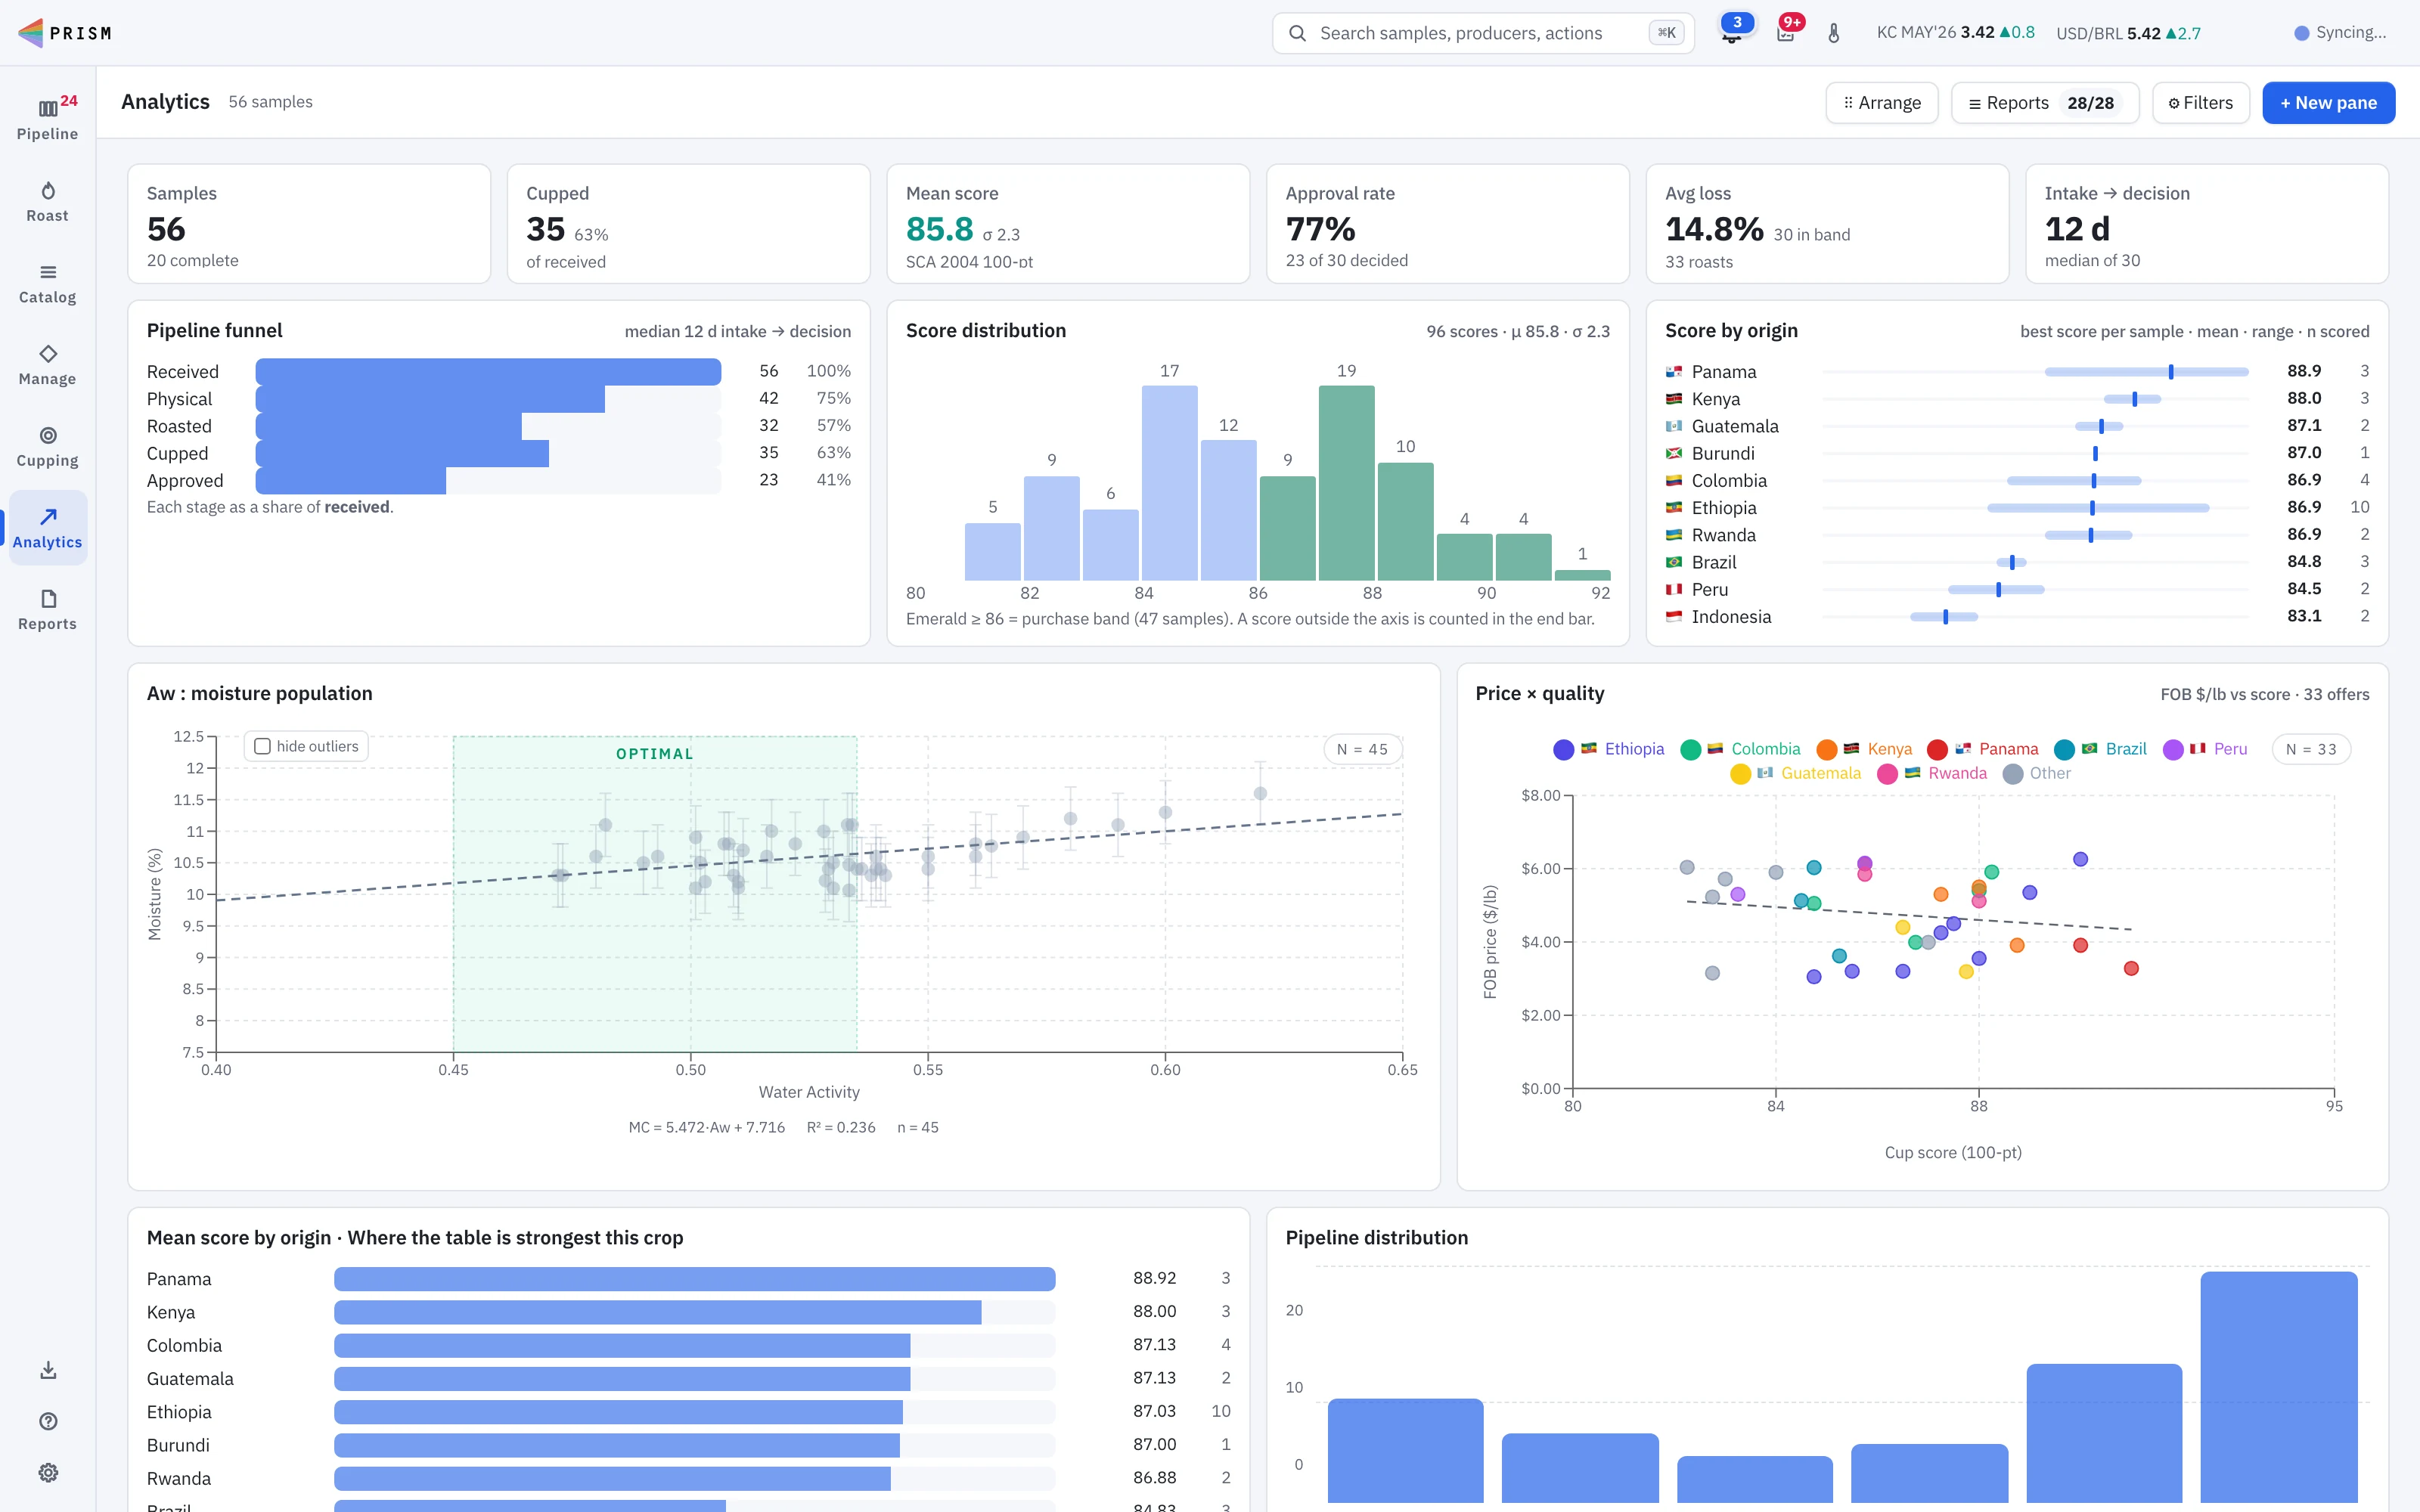
Your own panes
Build a chart without writing a query
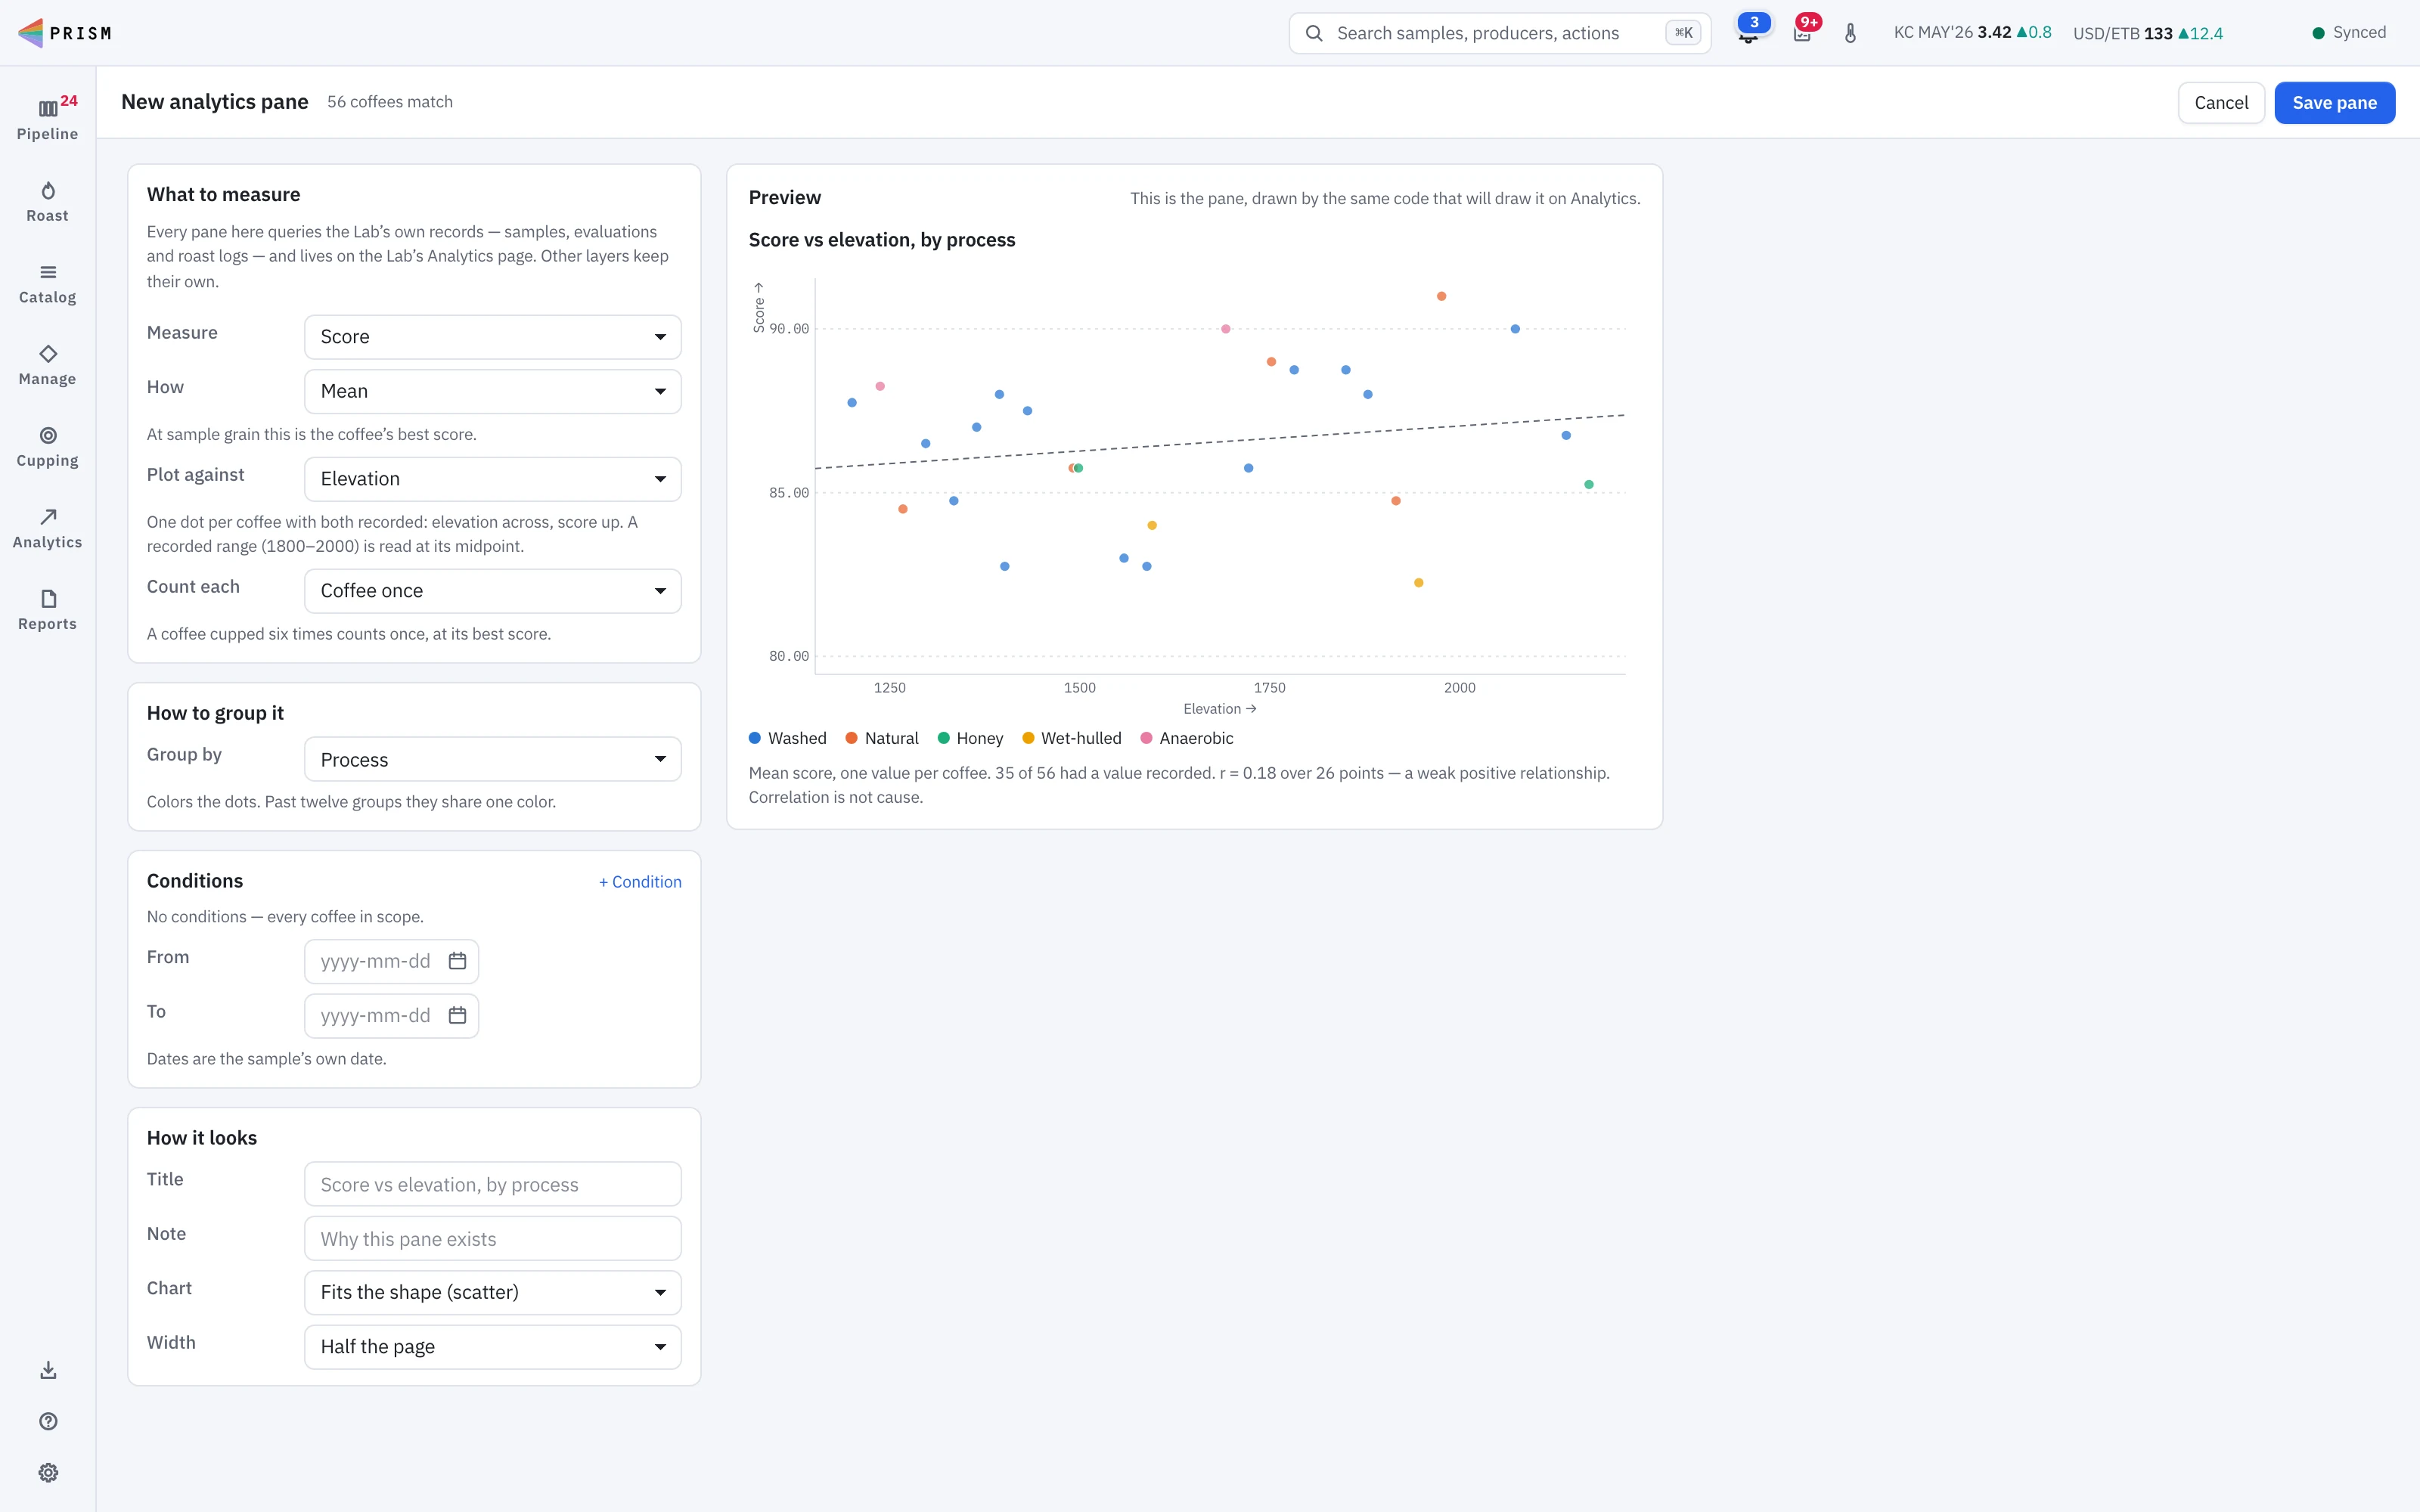
Pick what to measure, how to group it, and any conditions. Plot one measurement against another, or set one grouping against another as a shaded table. The preview is drawn by the same code that draws the saved pane, so what you approve is what you get.
- Group by origin, process, cultivar, producer, cupper, crop year and more
- Plot against: score against elevation, with the trend and r
- Against: origins down, crop years across
- Count each coffee once, or every evaluation for calibration
Producers and traceability
Every coffee traced to its farm
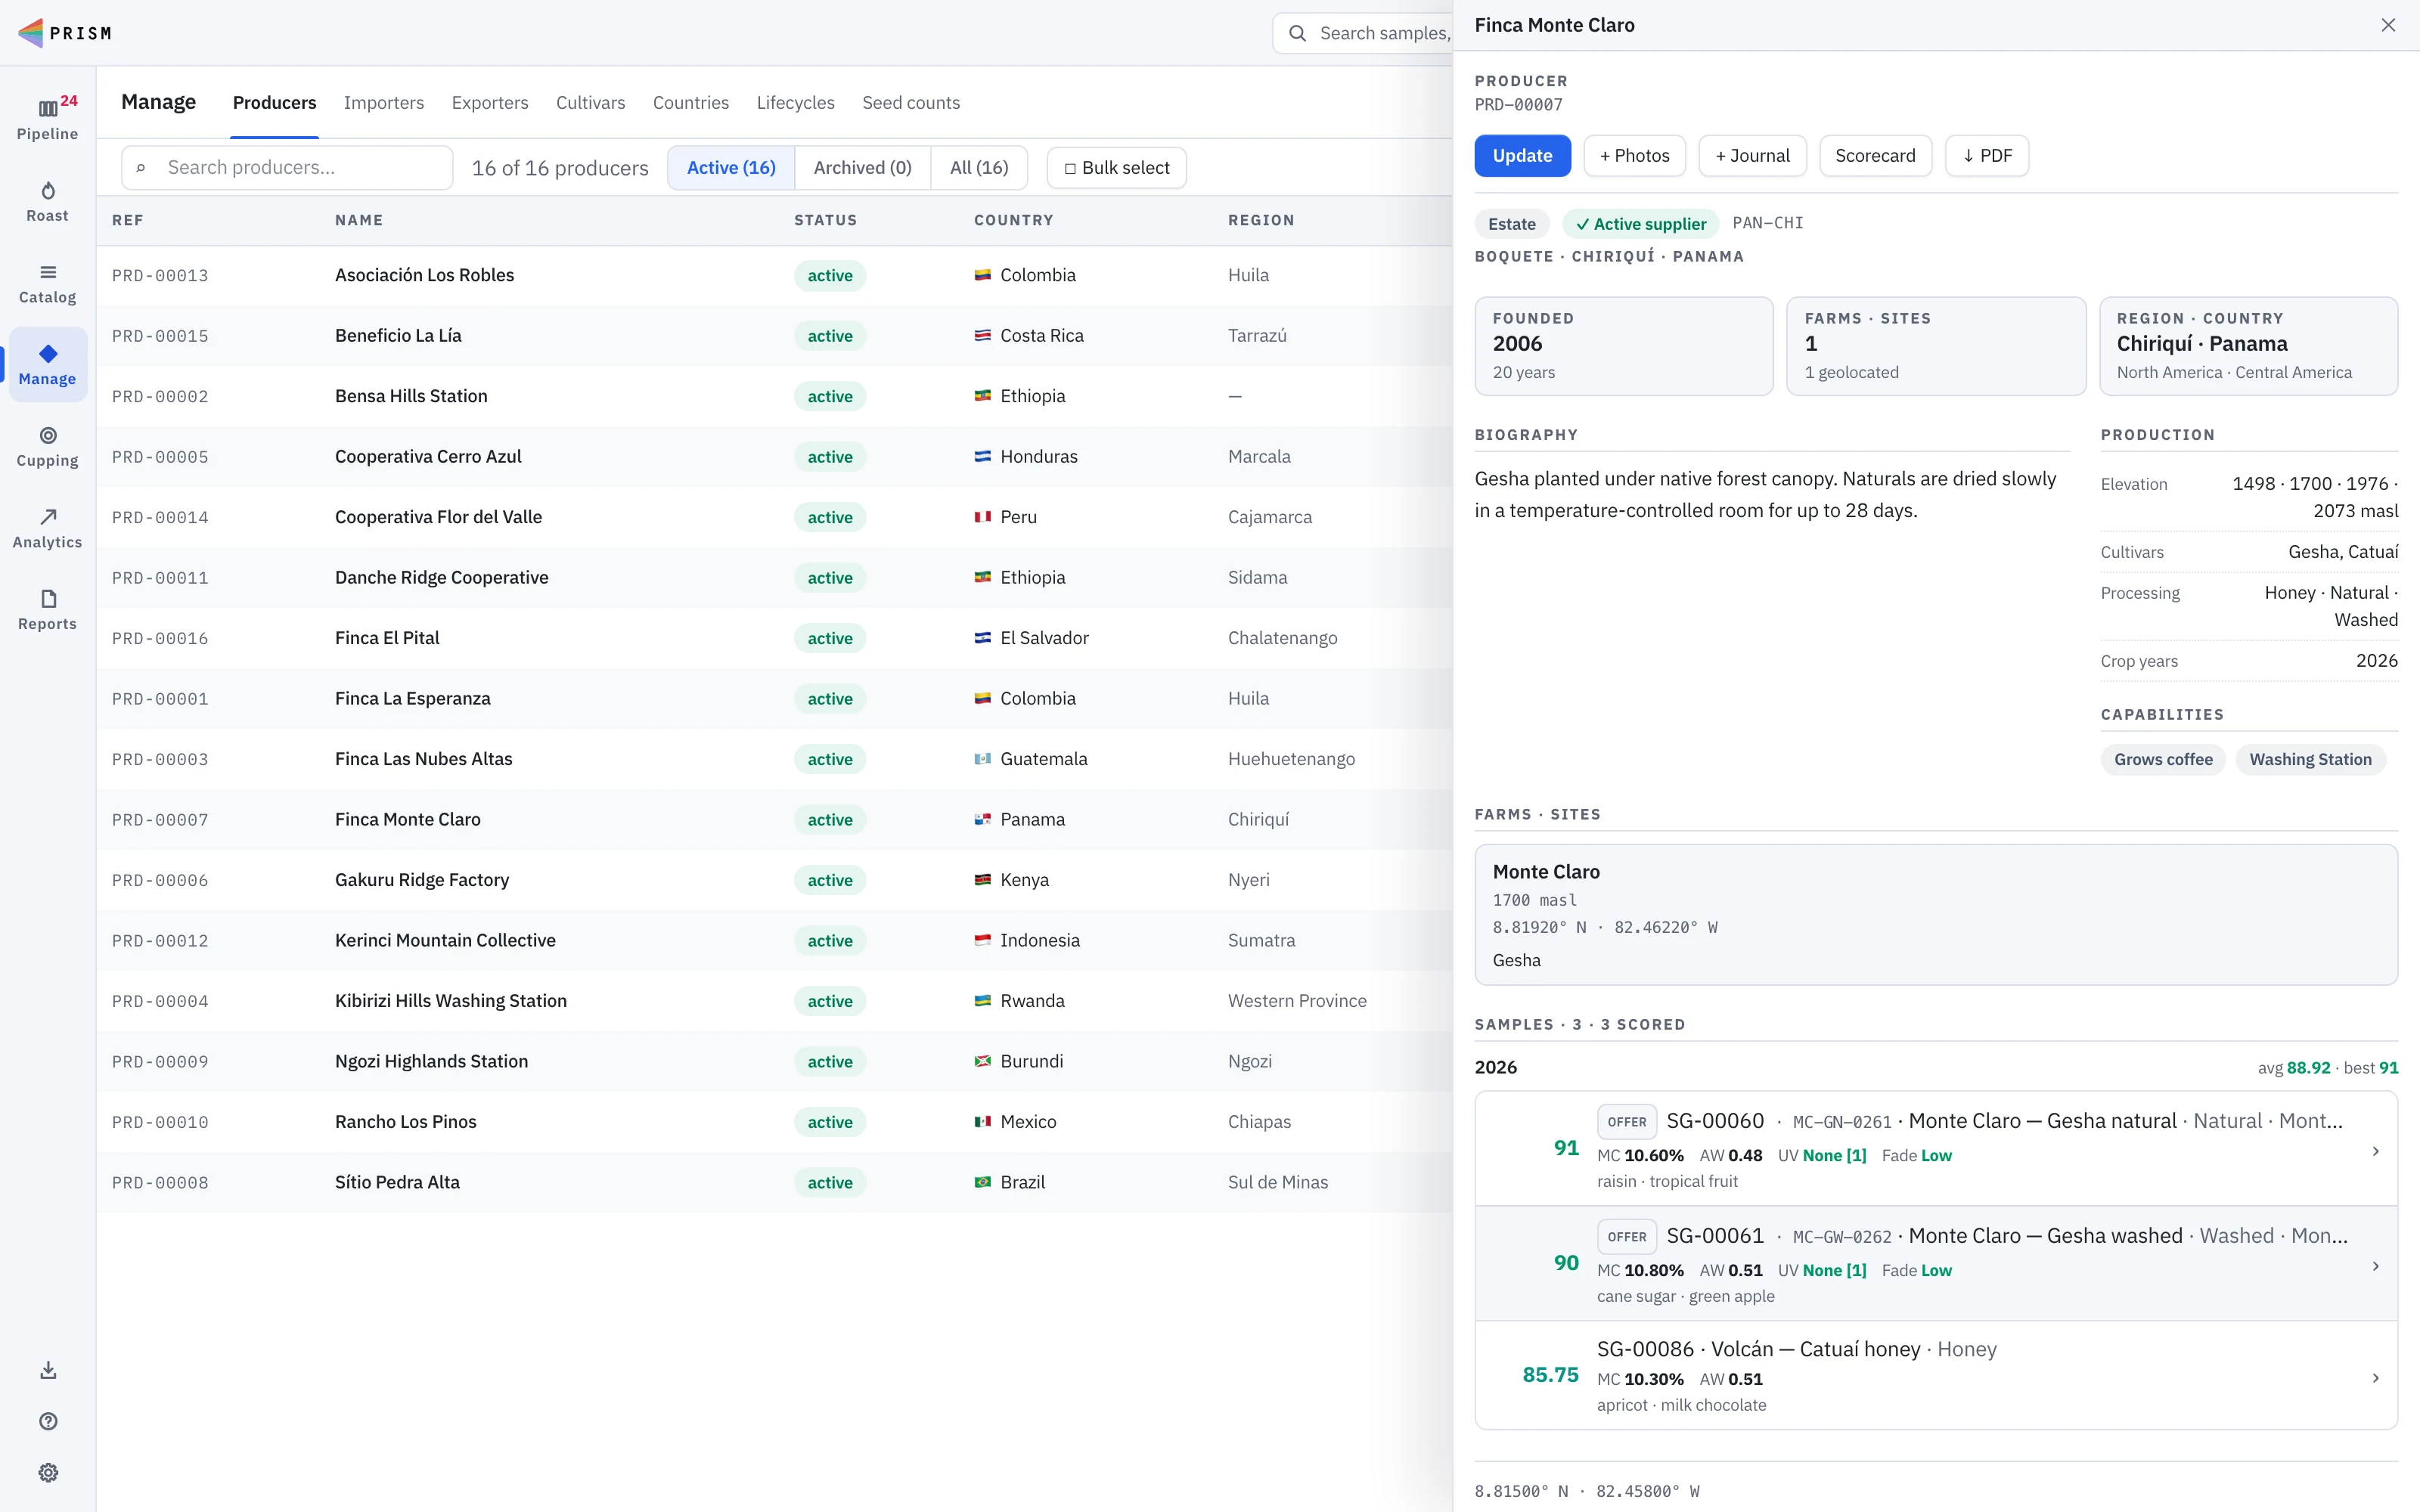
Each producer has a card: locality, biography, farms and sites with their GPS coordinates, elevation, cultivars and processing, site photography, a dated journal, and every sample you have had from them by crop year with its score. The farmgate price stays with the record: the traceability records EUDR due diligence relies on.
- Producers and farms with GPS coordinates
- Every sample linked to its producer and farm
- Farmgate prices kept with the record
- A producer profile PDF, and a public page with location data stripped from photos
- Cultivar narratives: what you know about each variety
EUDR
Ready for EUDR, from the farm map to the TRACES file
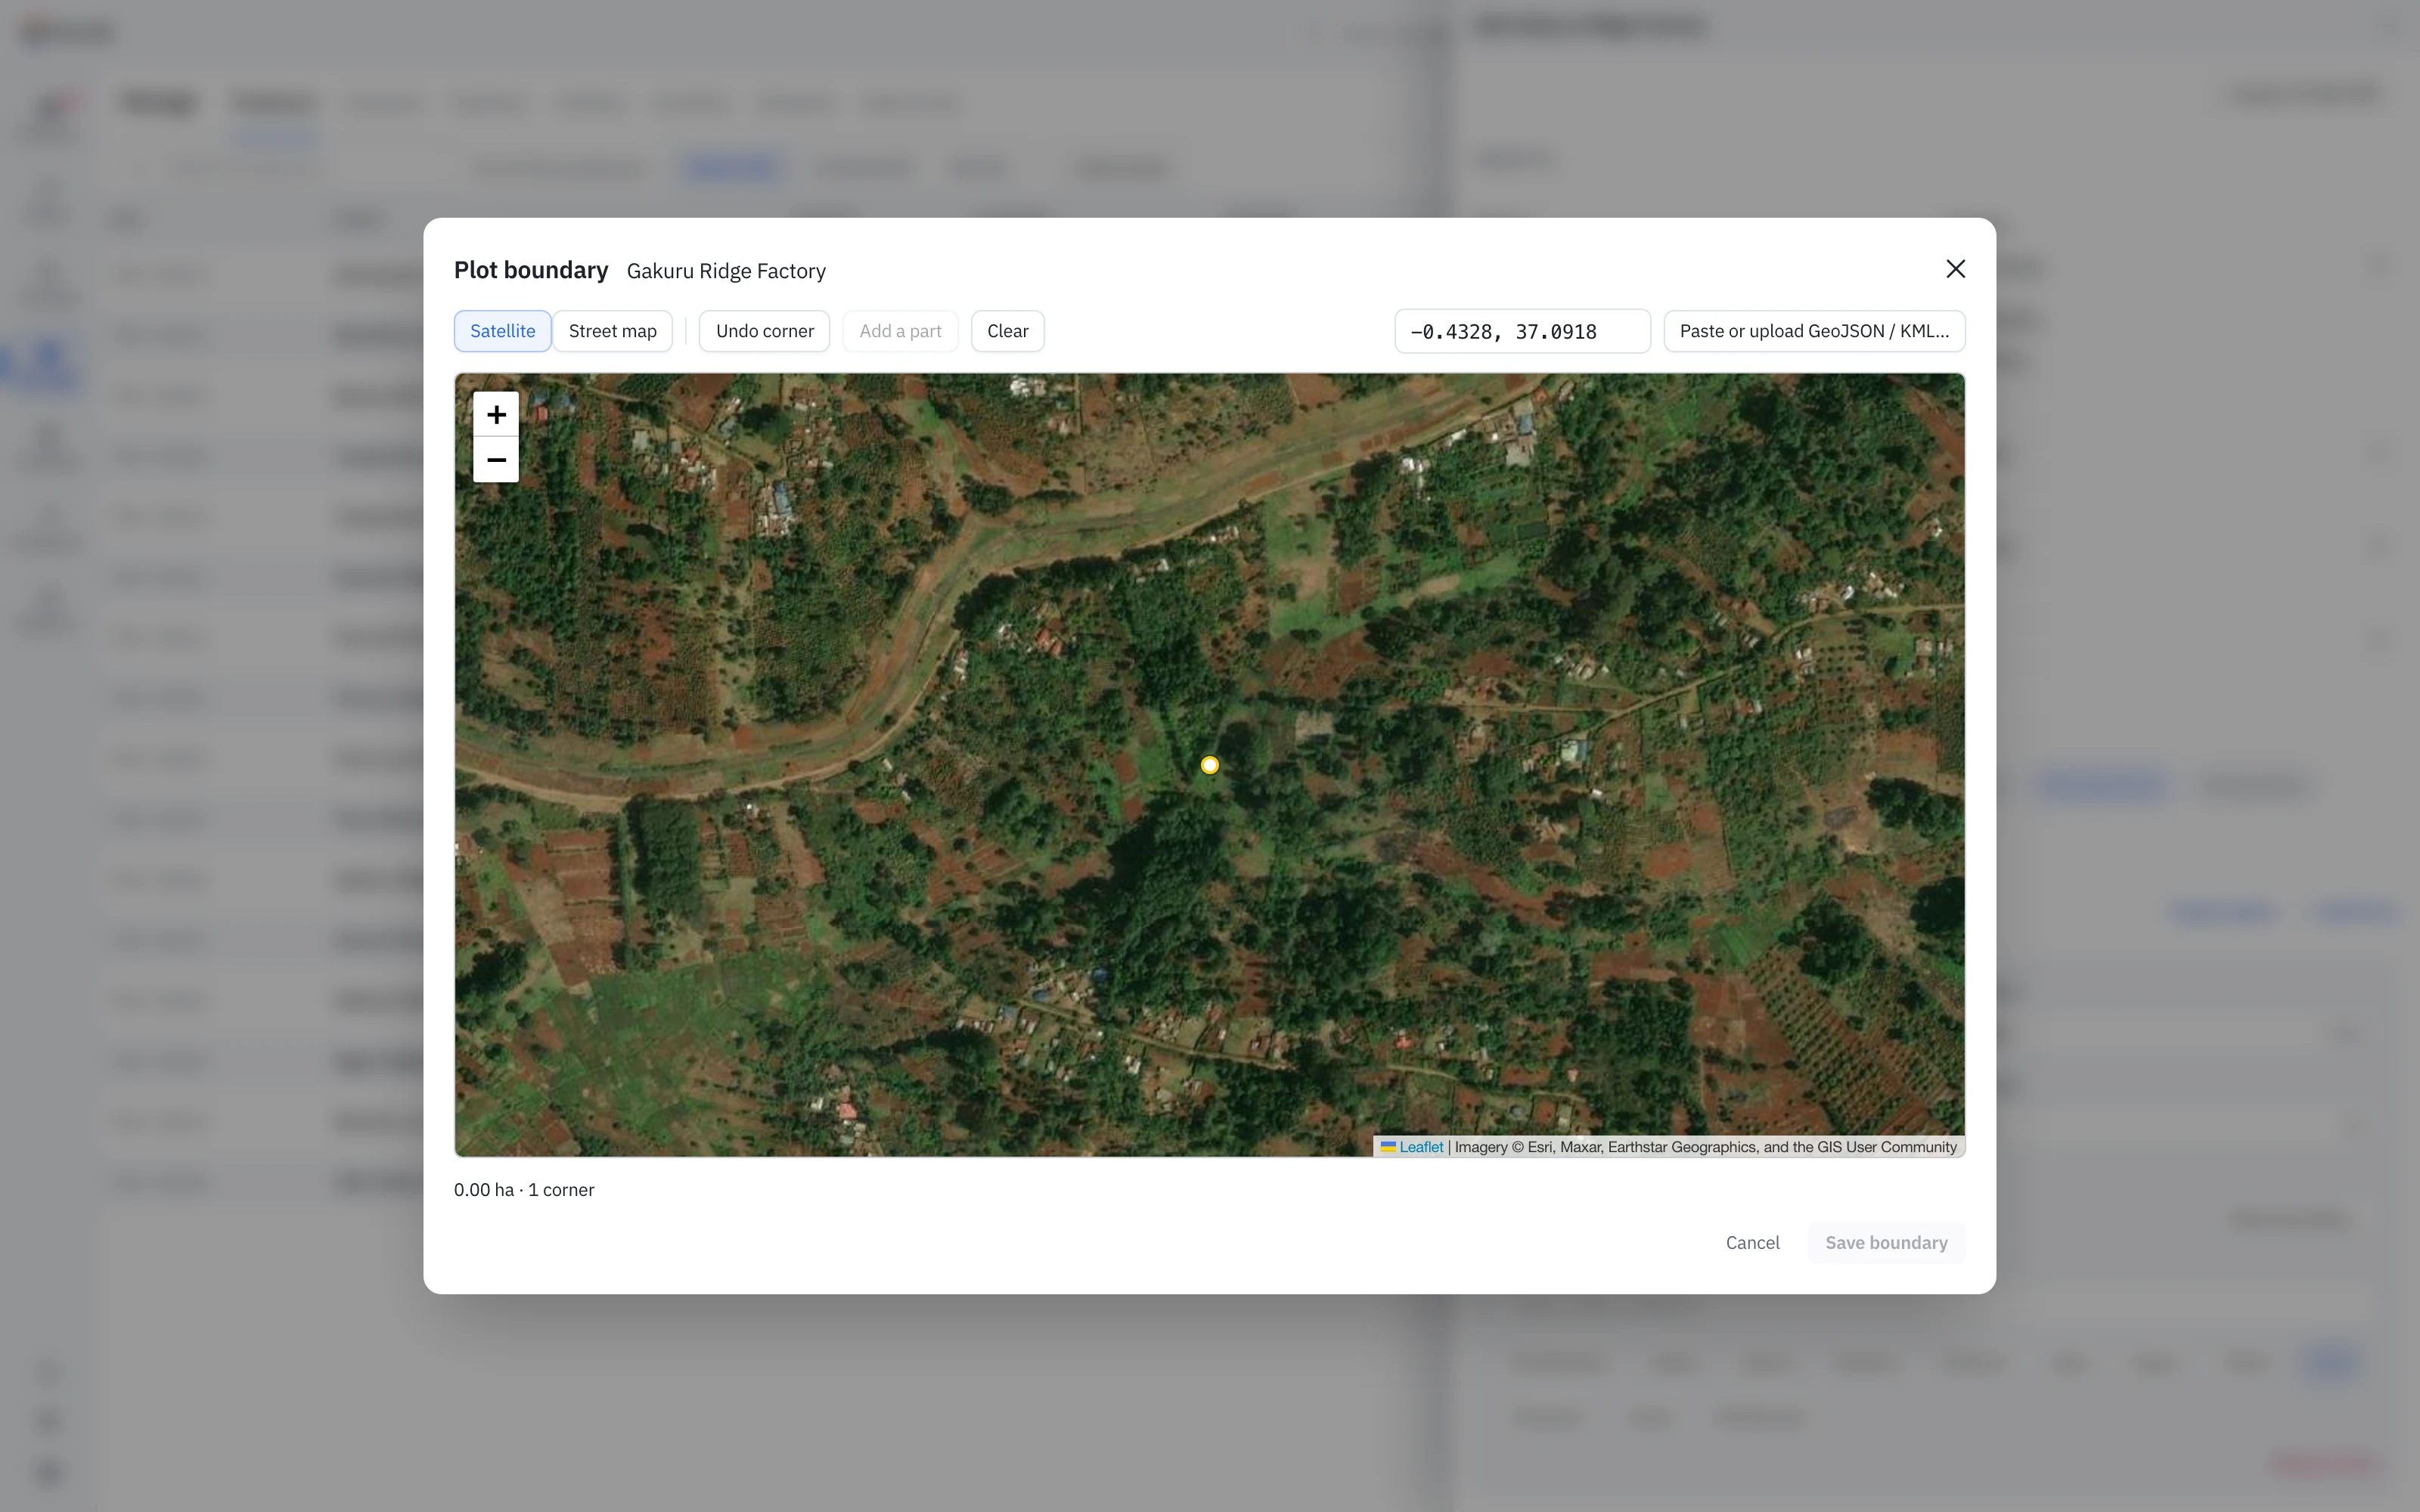
Draw each plot on a satellite map, or bring plots in from the field-mapping tools your suppliers already use: TerraTrac, INATrace (GIZ) and EUDR Tracer, or any GeoJSON or KML file. Prism measures the area and flags anything TRACES would refuse. Each sample keeps its due-diligence record beside its scores, and when it’s time to file, Prism exports the plots as the GeoJSON file TRACES accepts, after showing you anything that’s missing.
- Import plots from TerraTrac, INATrace (GIZ) and EUDR Tracer, or GeoJSON and KML
- Plot boundaries drawn on a satellite map, with the area measured for you
- A GPS point for small plots, a boundary where EUDR asks for one
- Suppliers’ DDS references, risk assessment and documents on each sample
- EORI and VAT numbers on exporters and importers
- GeoJSON export in the format TRACES accepts, with a gap report before download
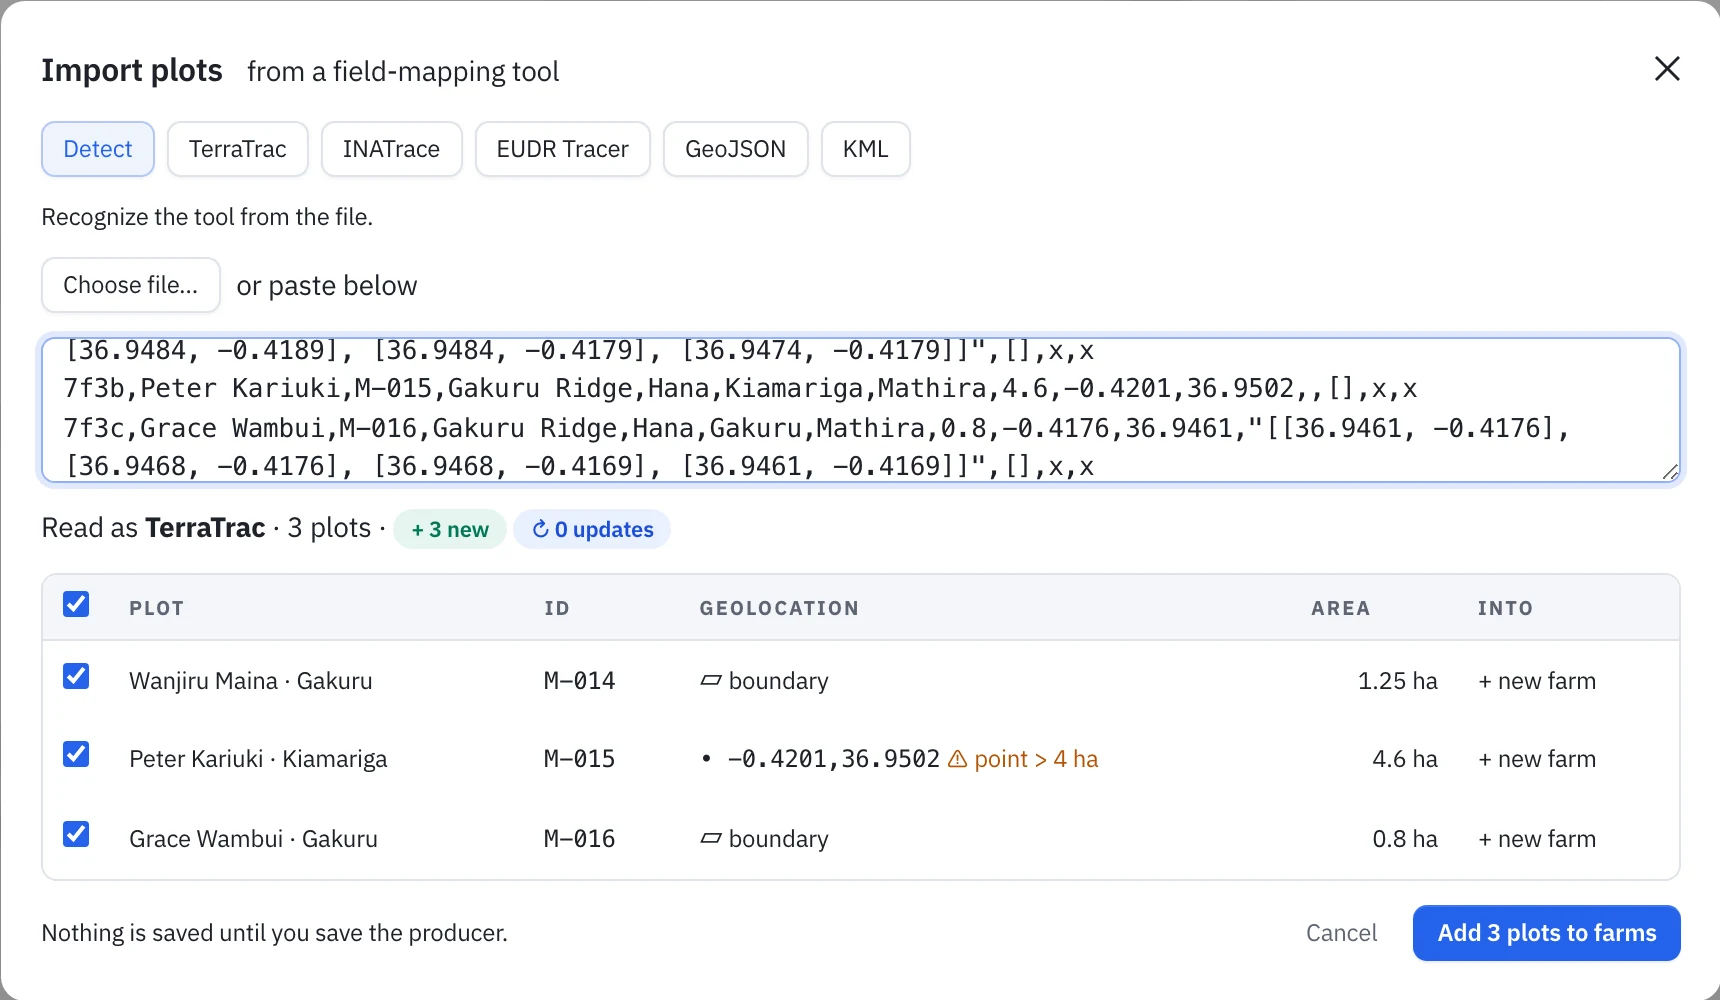
Import: paste or choose a TerraTrac, INATrace or EUDR Tracer file and Prism recognizes the tool, then shows every plot before anything is saved.
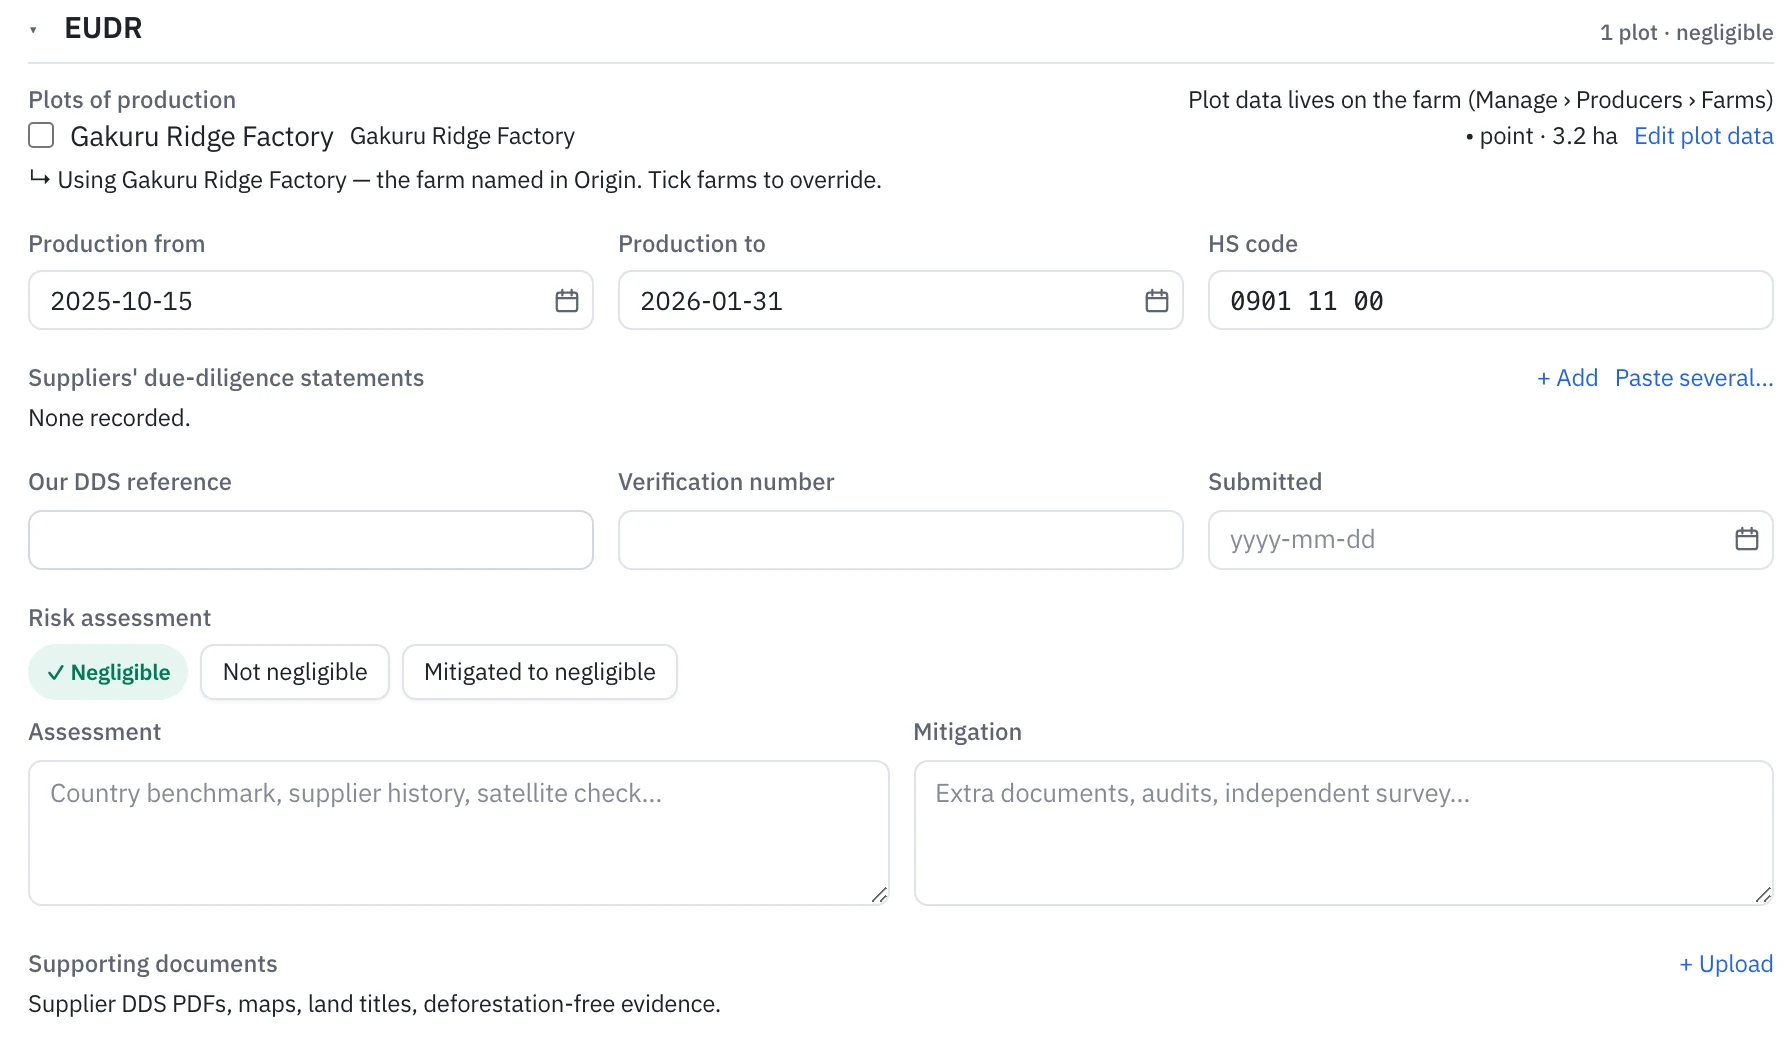
On the sample: the plot, production period, HS code, suppliers’ DDS references, risk assessment and documents, all optional.
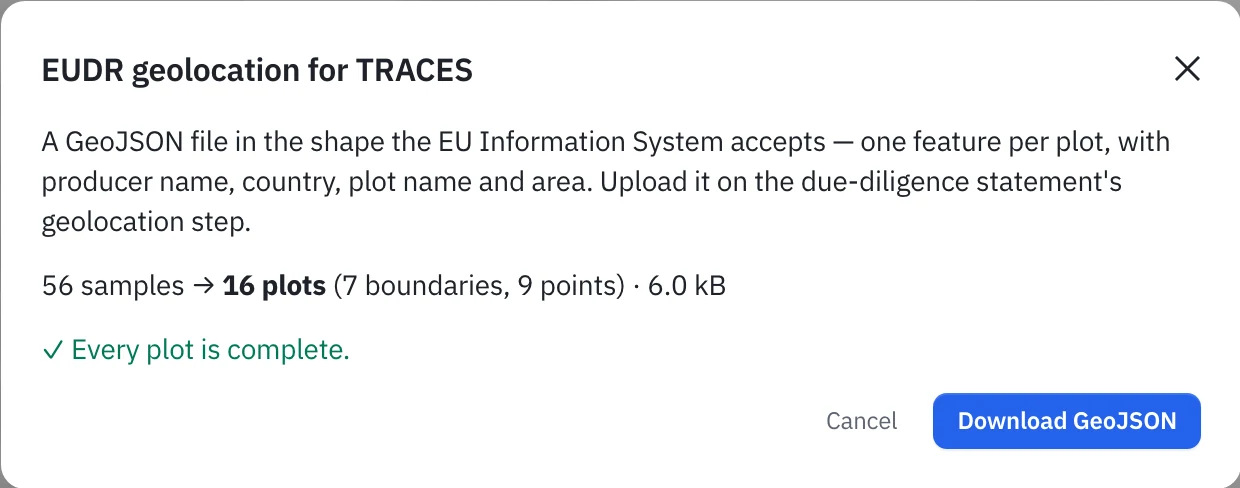
Export: one GeoJSON file per filing, in the shape TRACES accepts, after a check of every plot, so nothing missing gets filed.
Market and the room
Watch the market, and the rooms your coffee lives in
Market dashboard
The C-market, always in view
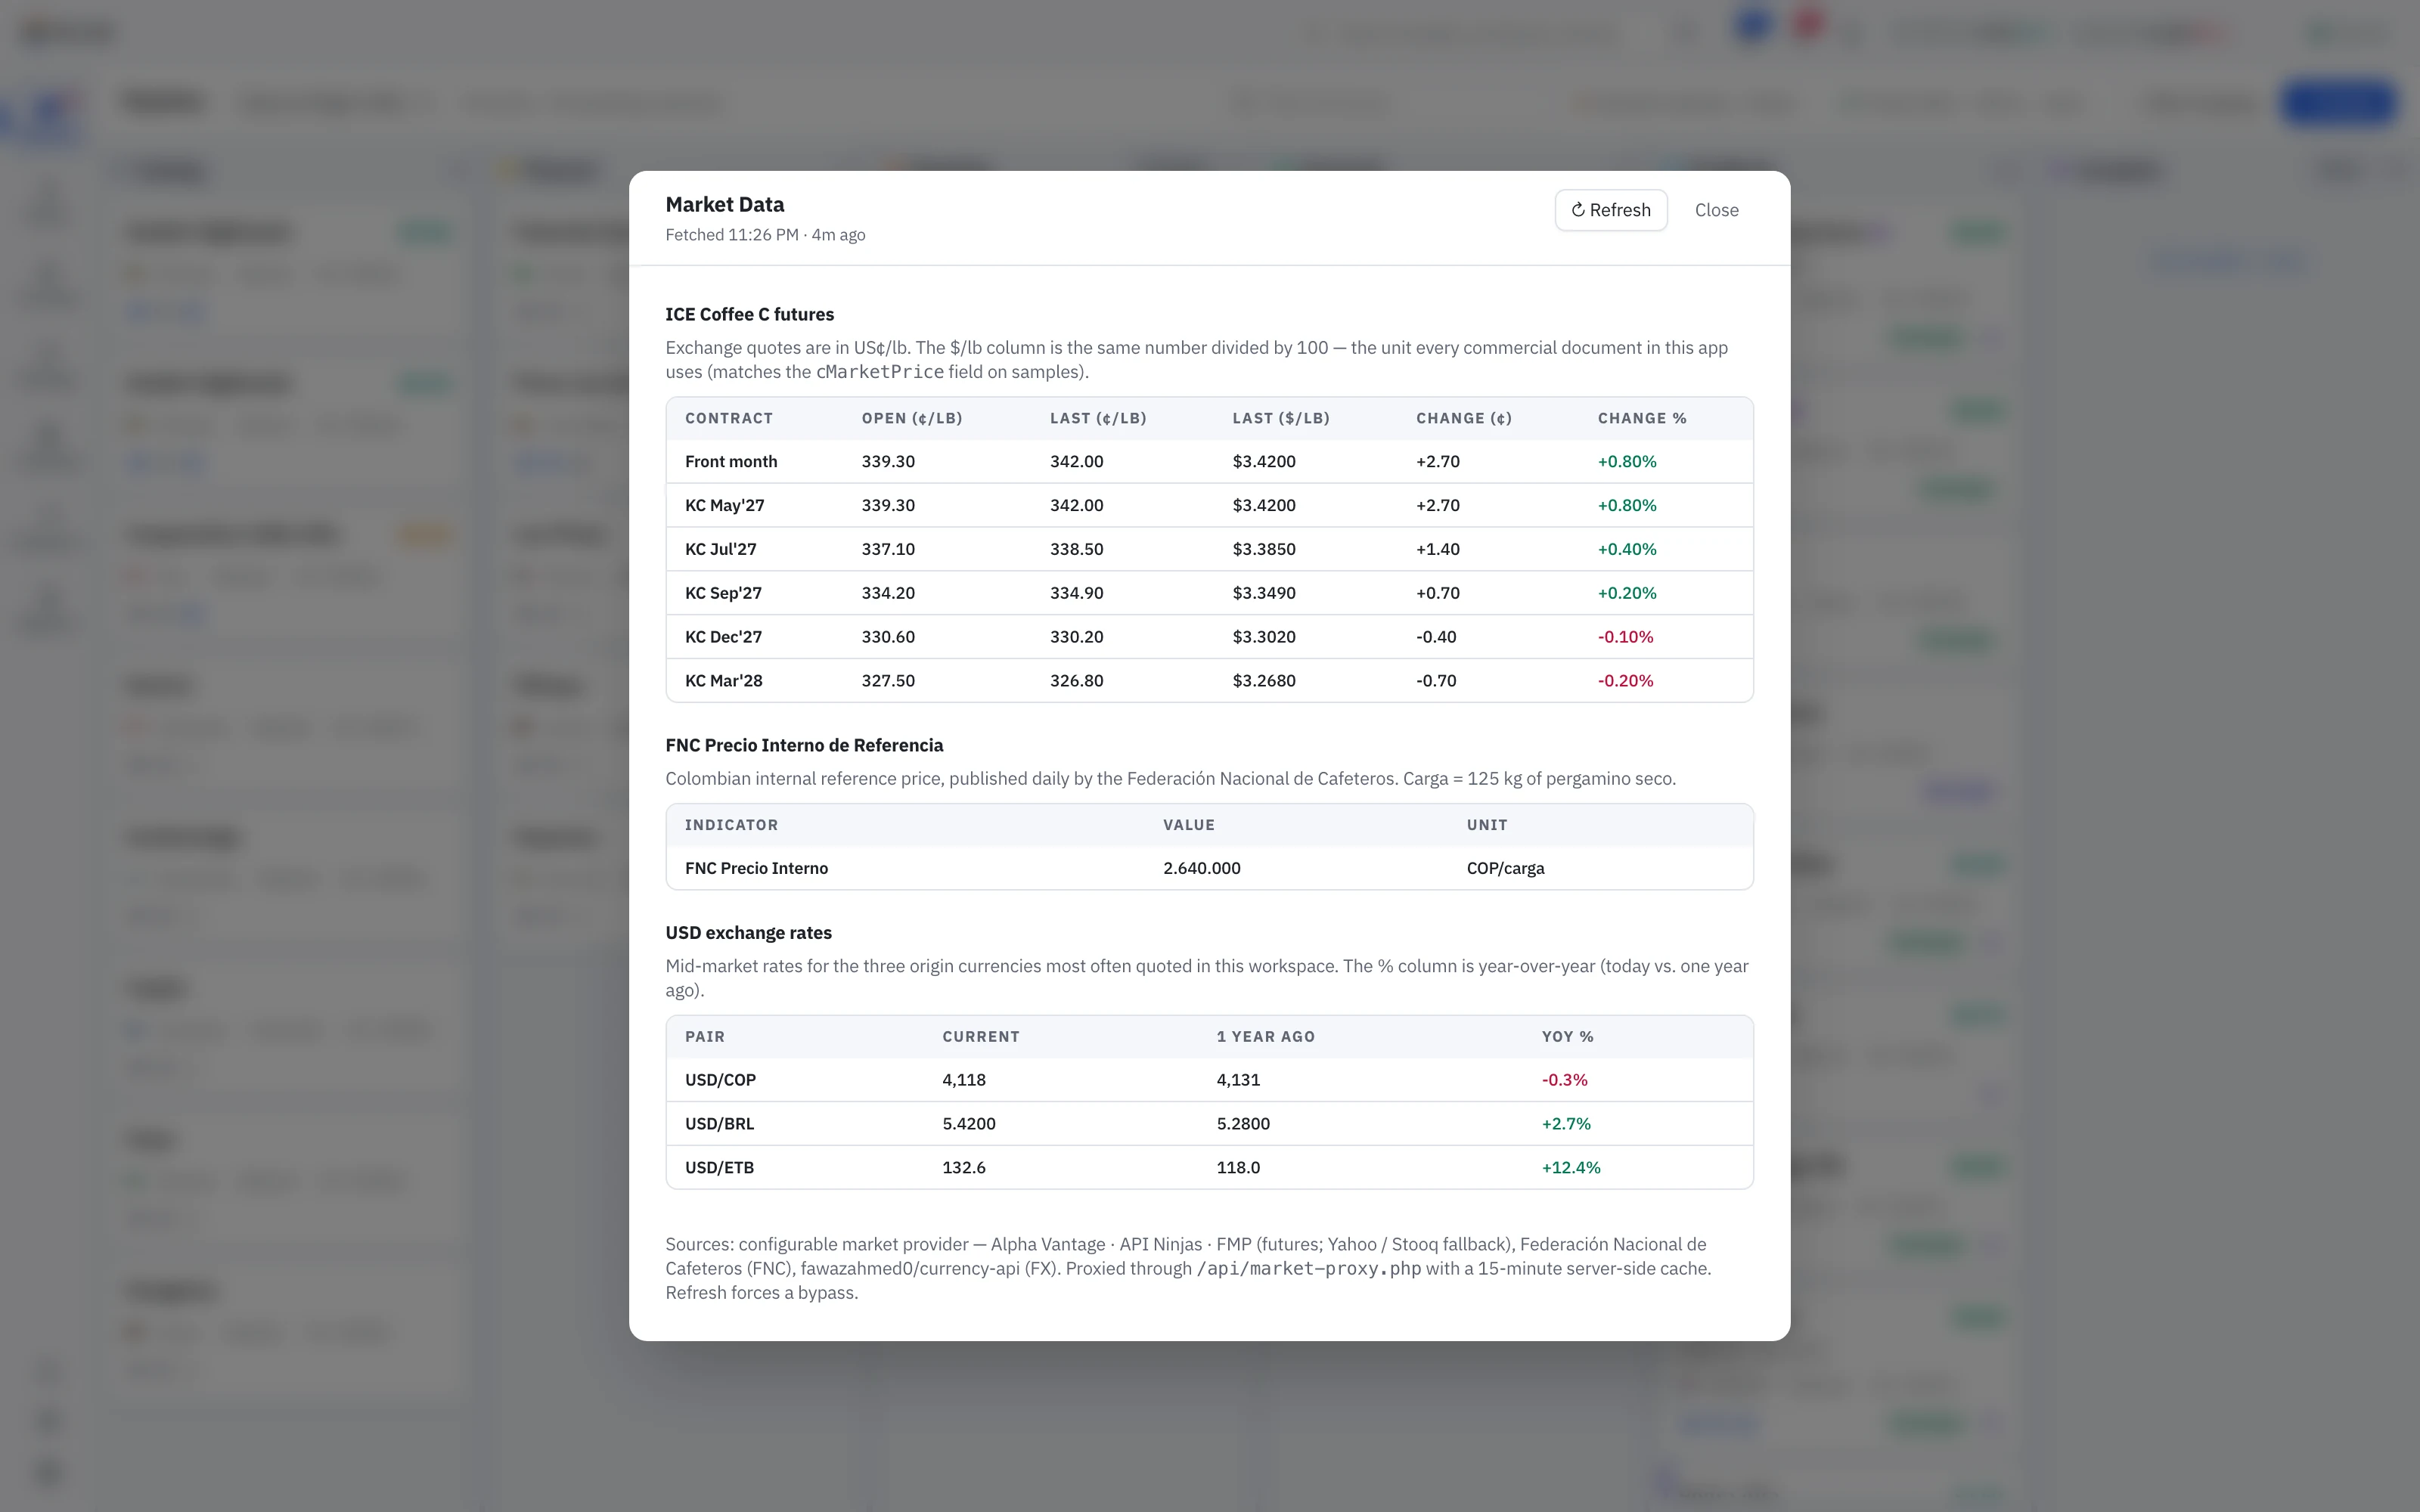
The ICE C-market front month sits in the title bar on every screen, with FNC prices and exchange rates beside it. Click it for the full board: every contract, the rates, and when they were fetched. Fetch fills the C-market and FX rate onto a sample at intake.
- C-market front month always visible
- FNC price and exchange rates in rotation beside it
- The full board one click away
- Market and FX recorded on each sample at sampling
Environmental sensors
Monitor your sample storage, and your roasting room
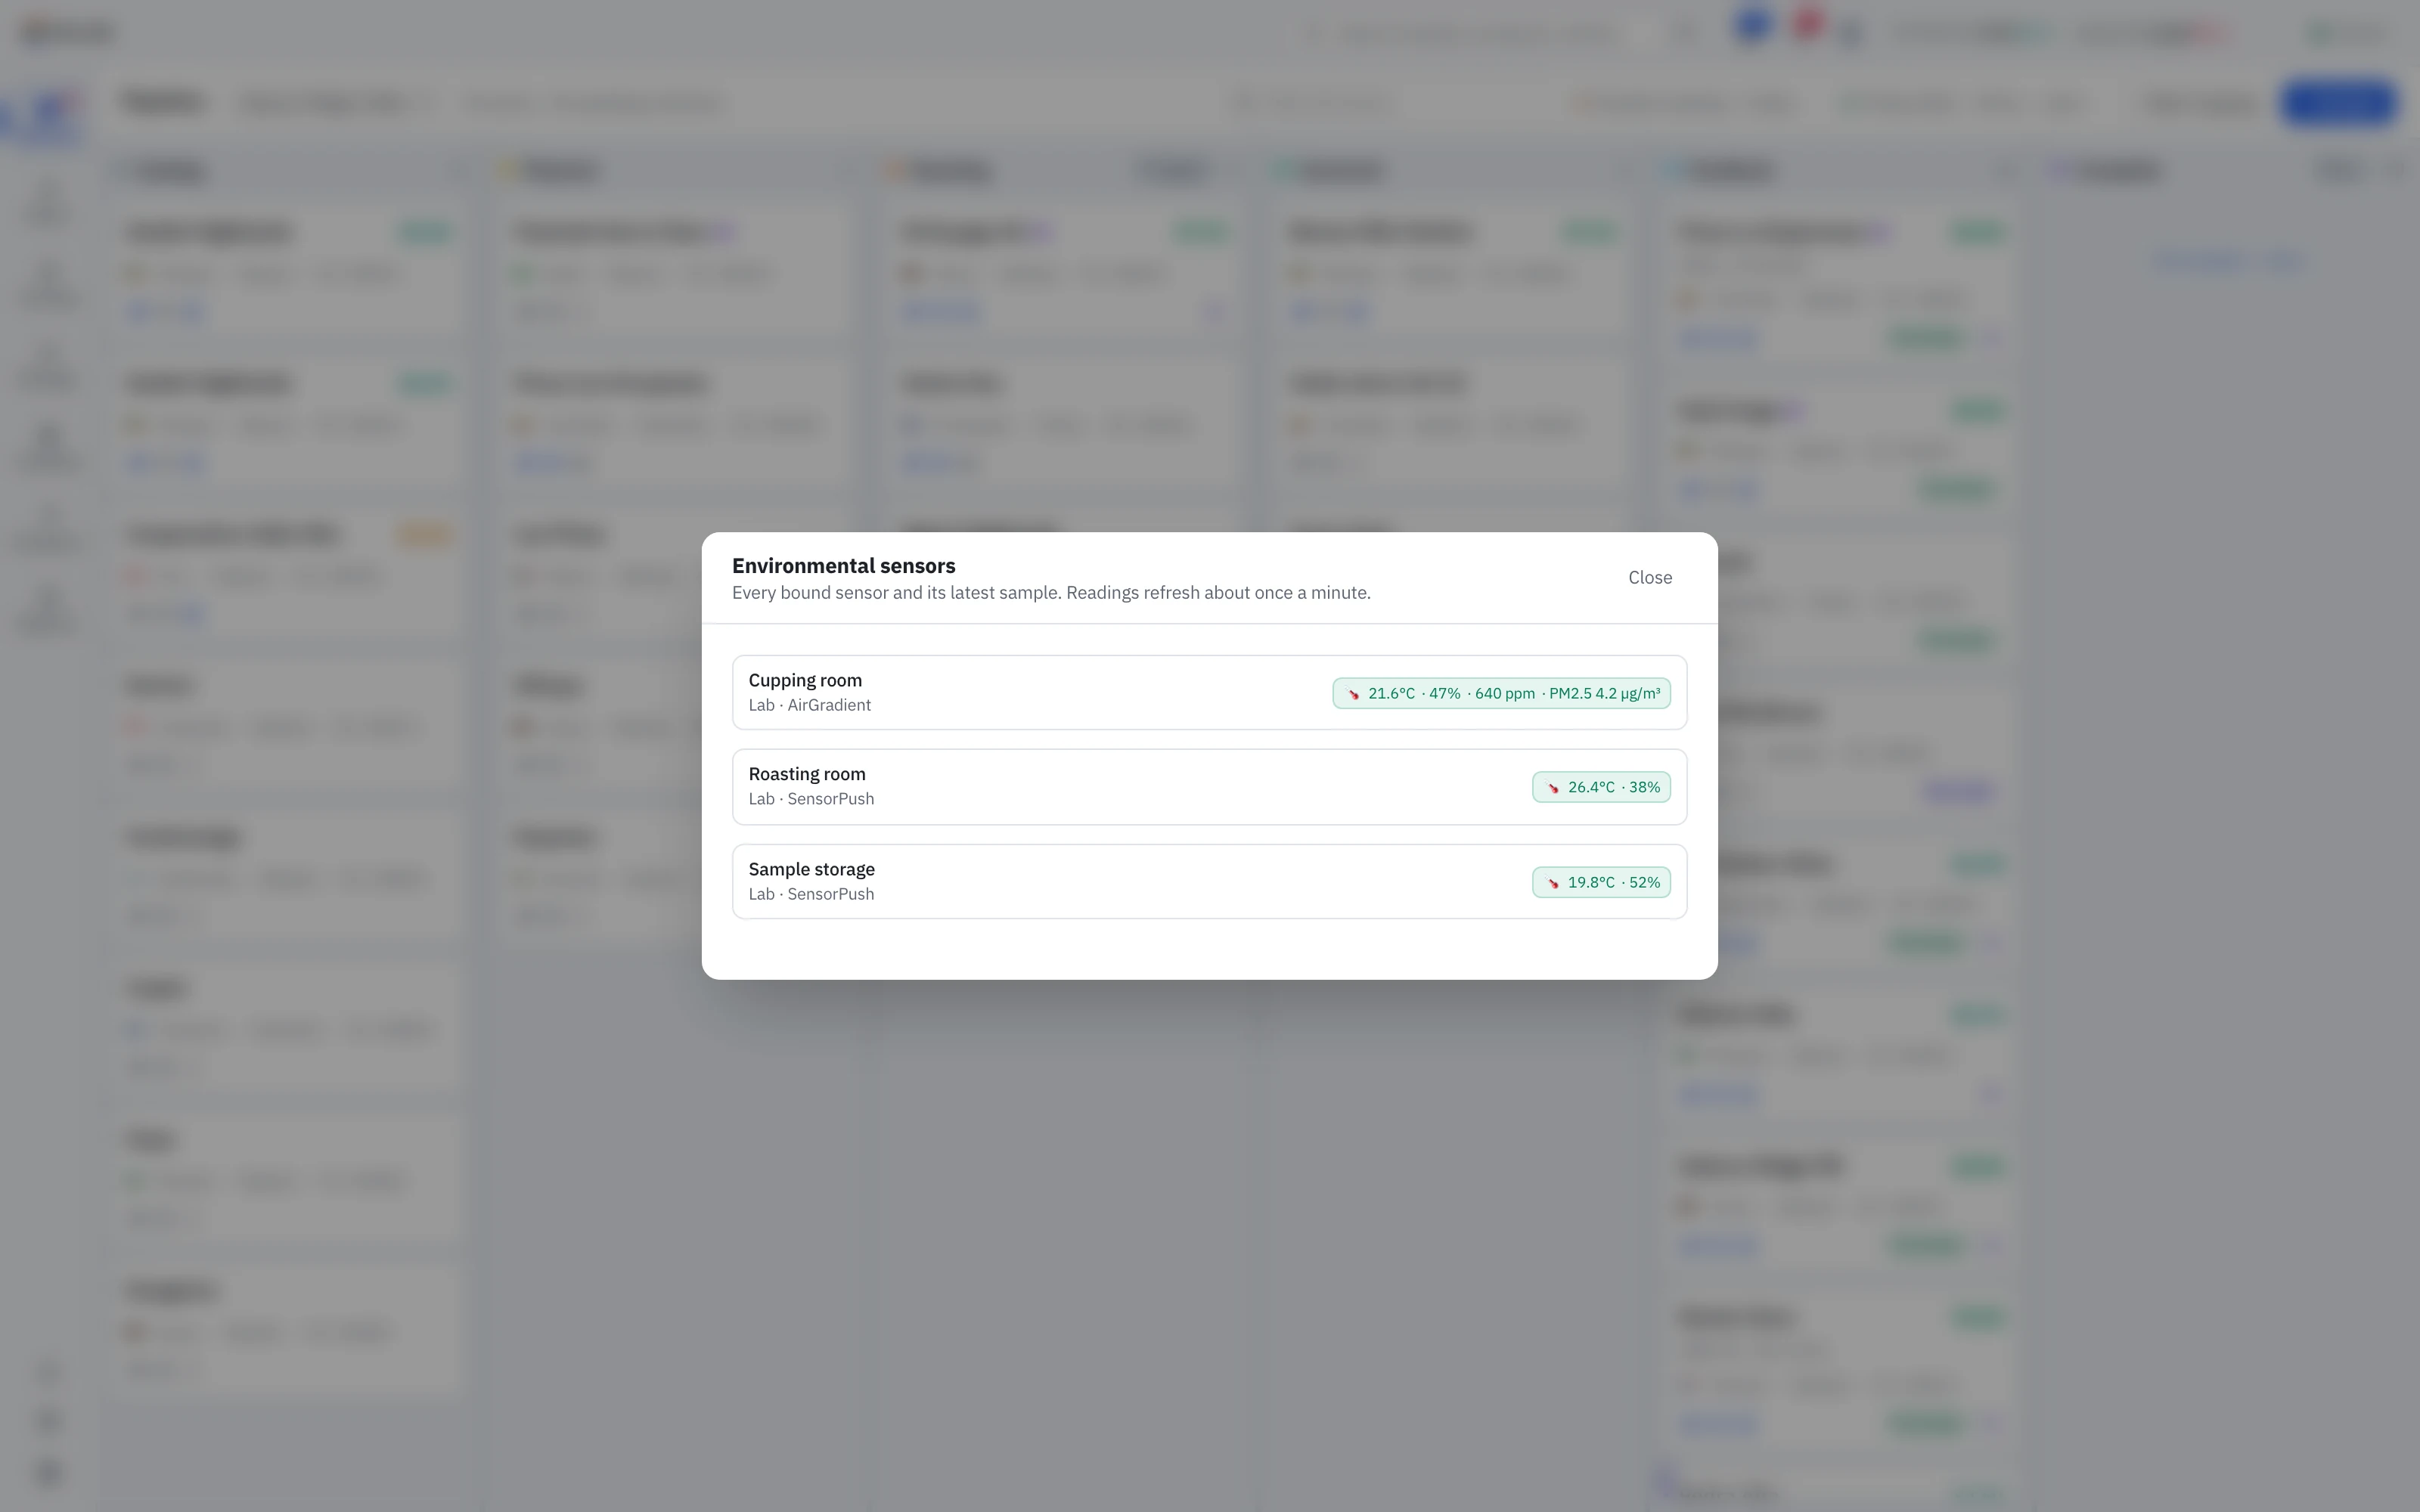
Connect SensorPush, Ubibot or AirGradient monitors and name the rooms they watch: sample storage, the roasting room, the cupping room. Temperature and humidity are one click away from any screen, with CO₂ and PM2.5 where an AirGradient measures them.
- SensorPush, Ubibot and AirGradient
- Name each room and pick its monitor
- Temperature and humidity from any screen
- CO₂ and PM2.5 from AirGradient monitors
Make it yours
Your lab, the way you like to read it
Light or dark, six interface fonts, a text size from 76% to 120%, comfortable or compact tables. Each person sets their own, on their own screen, and nobody else’s view changes.
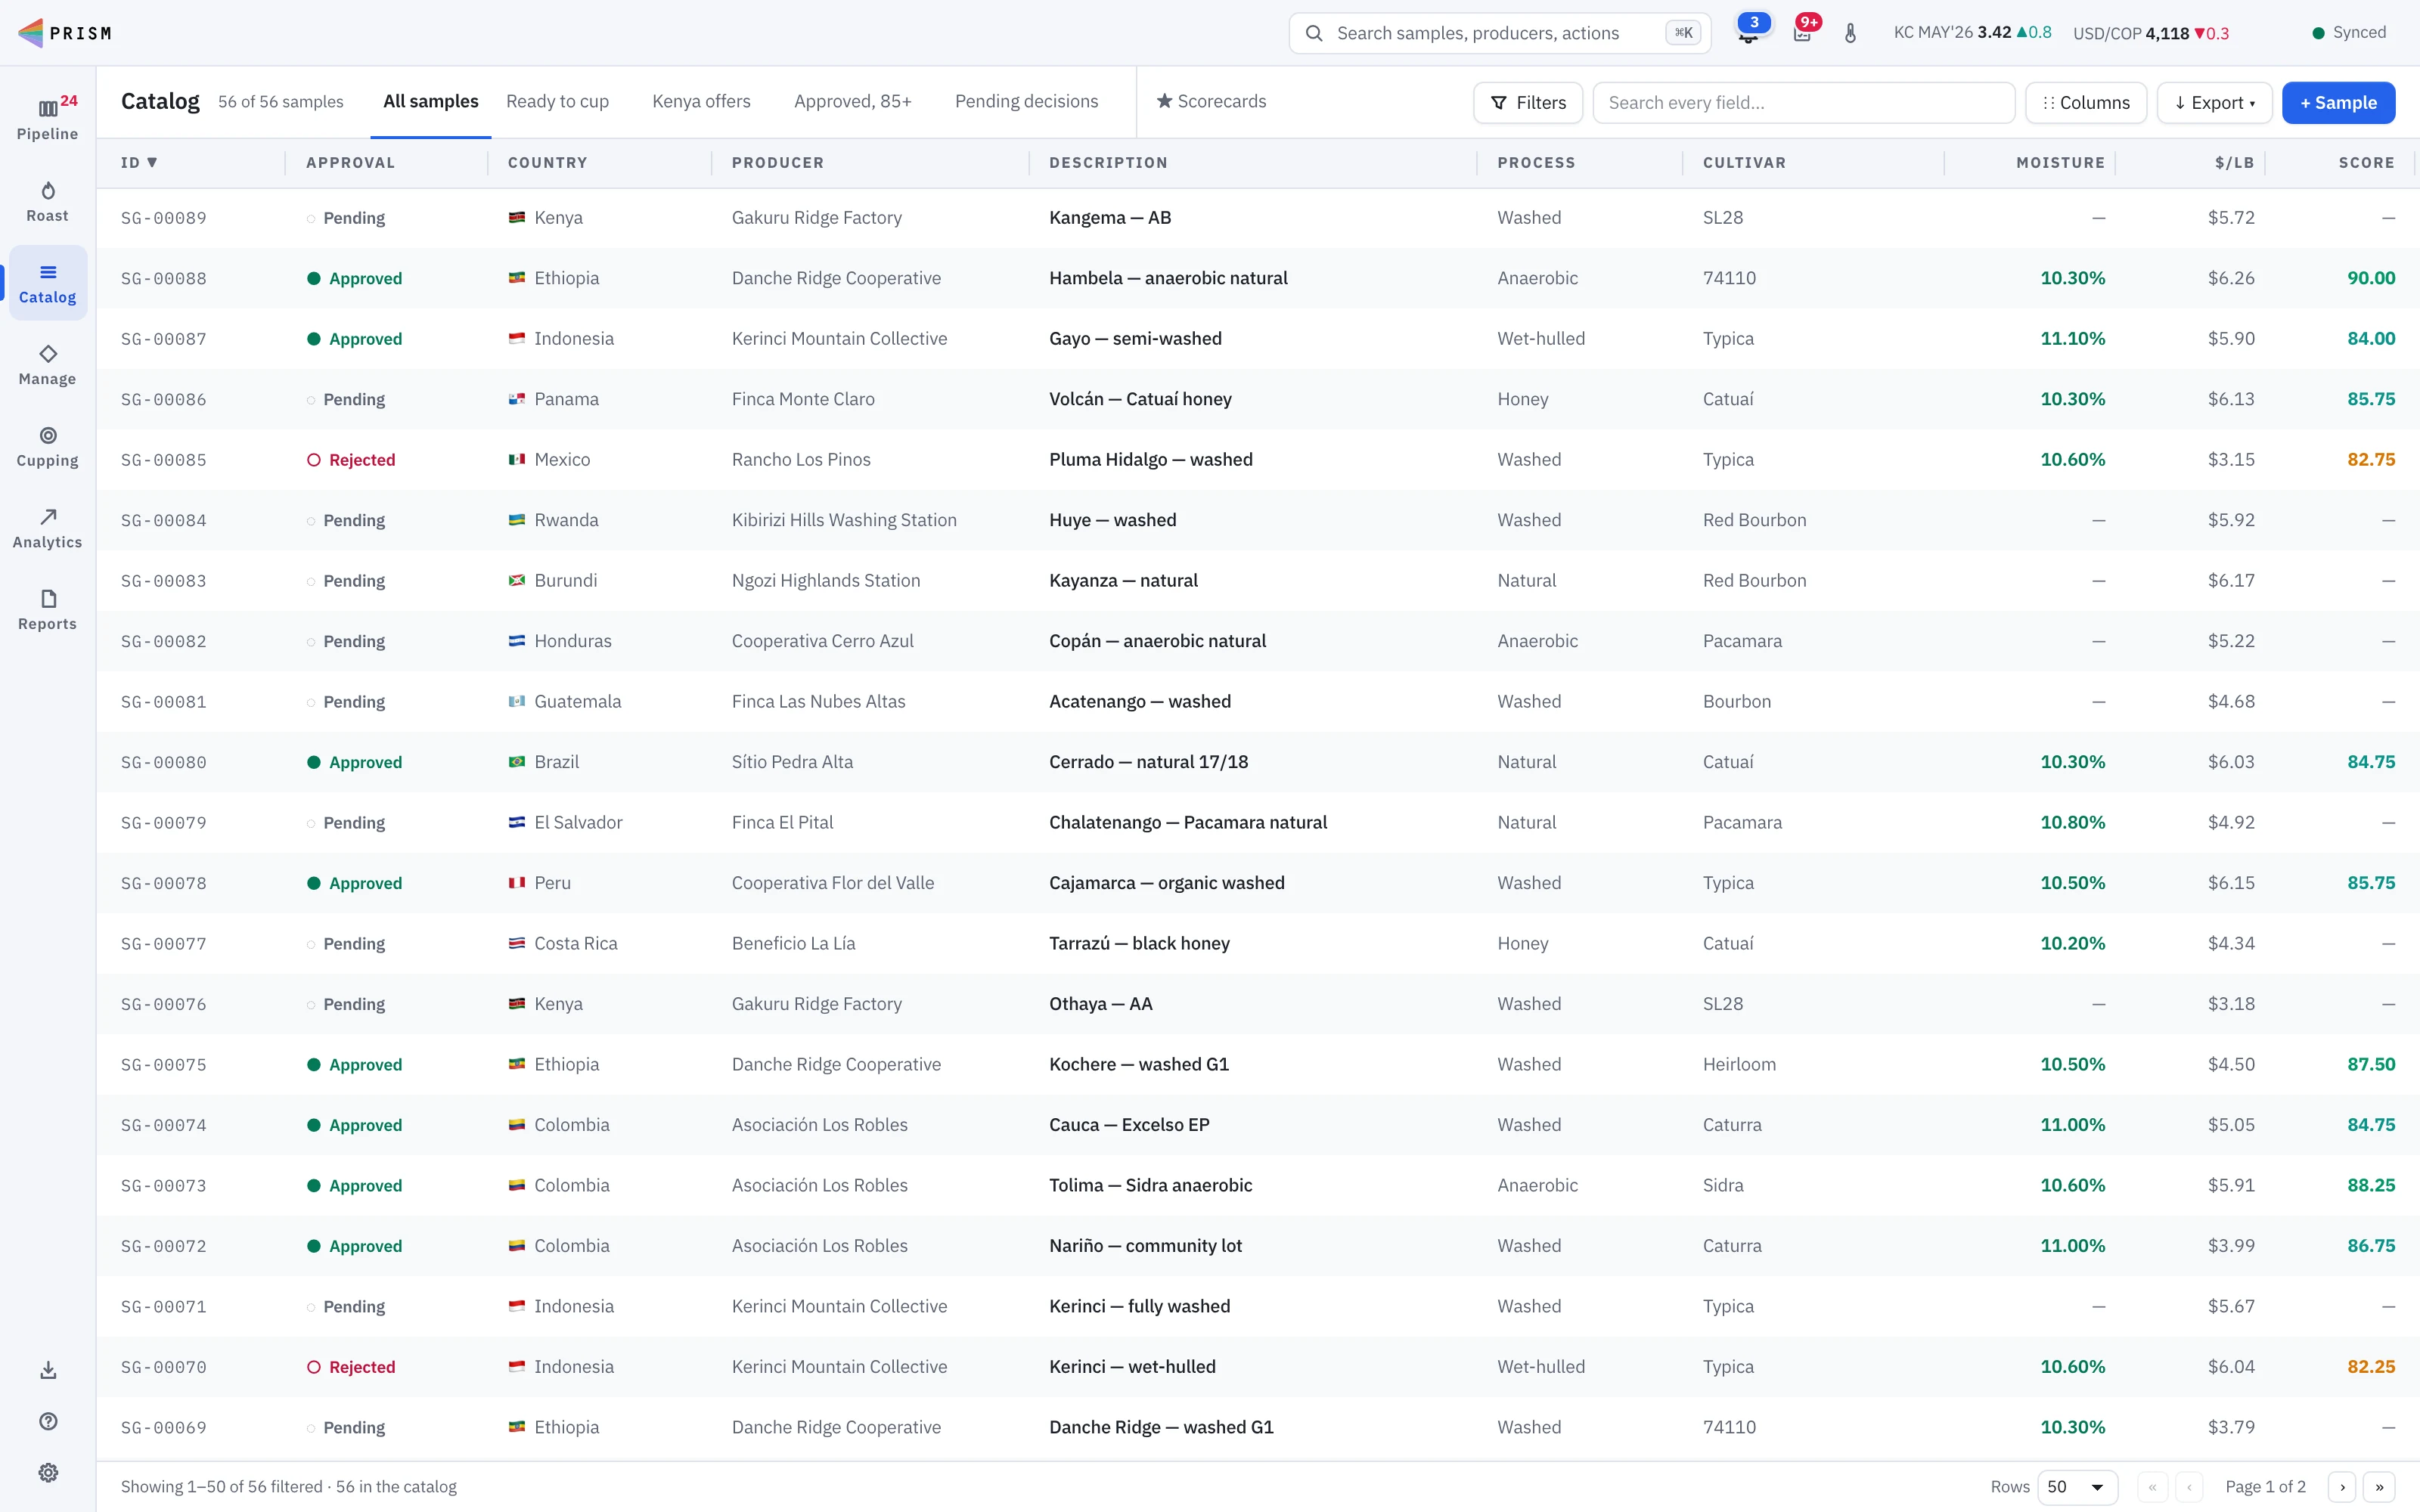
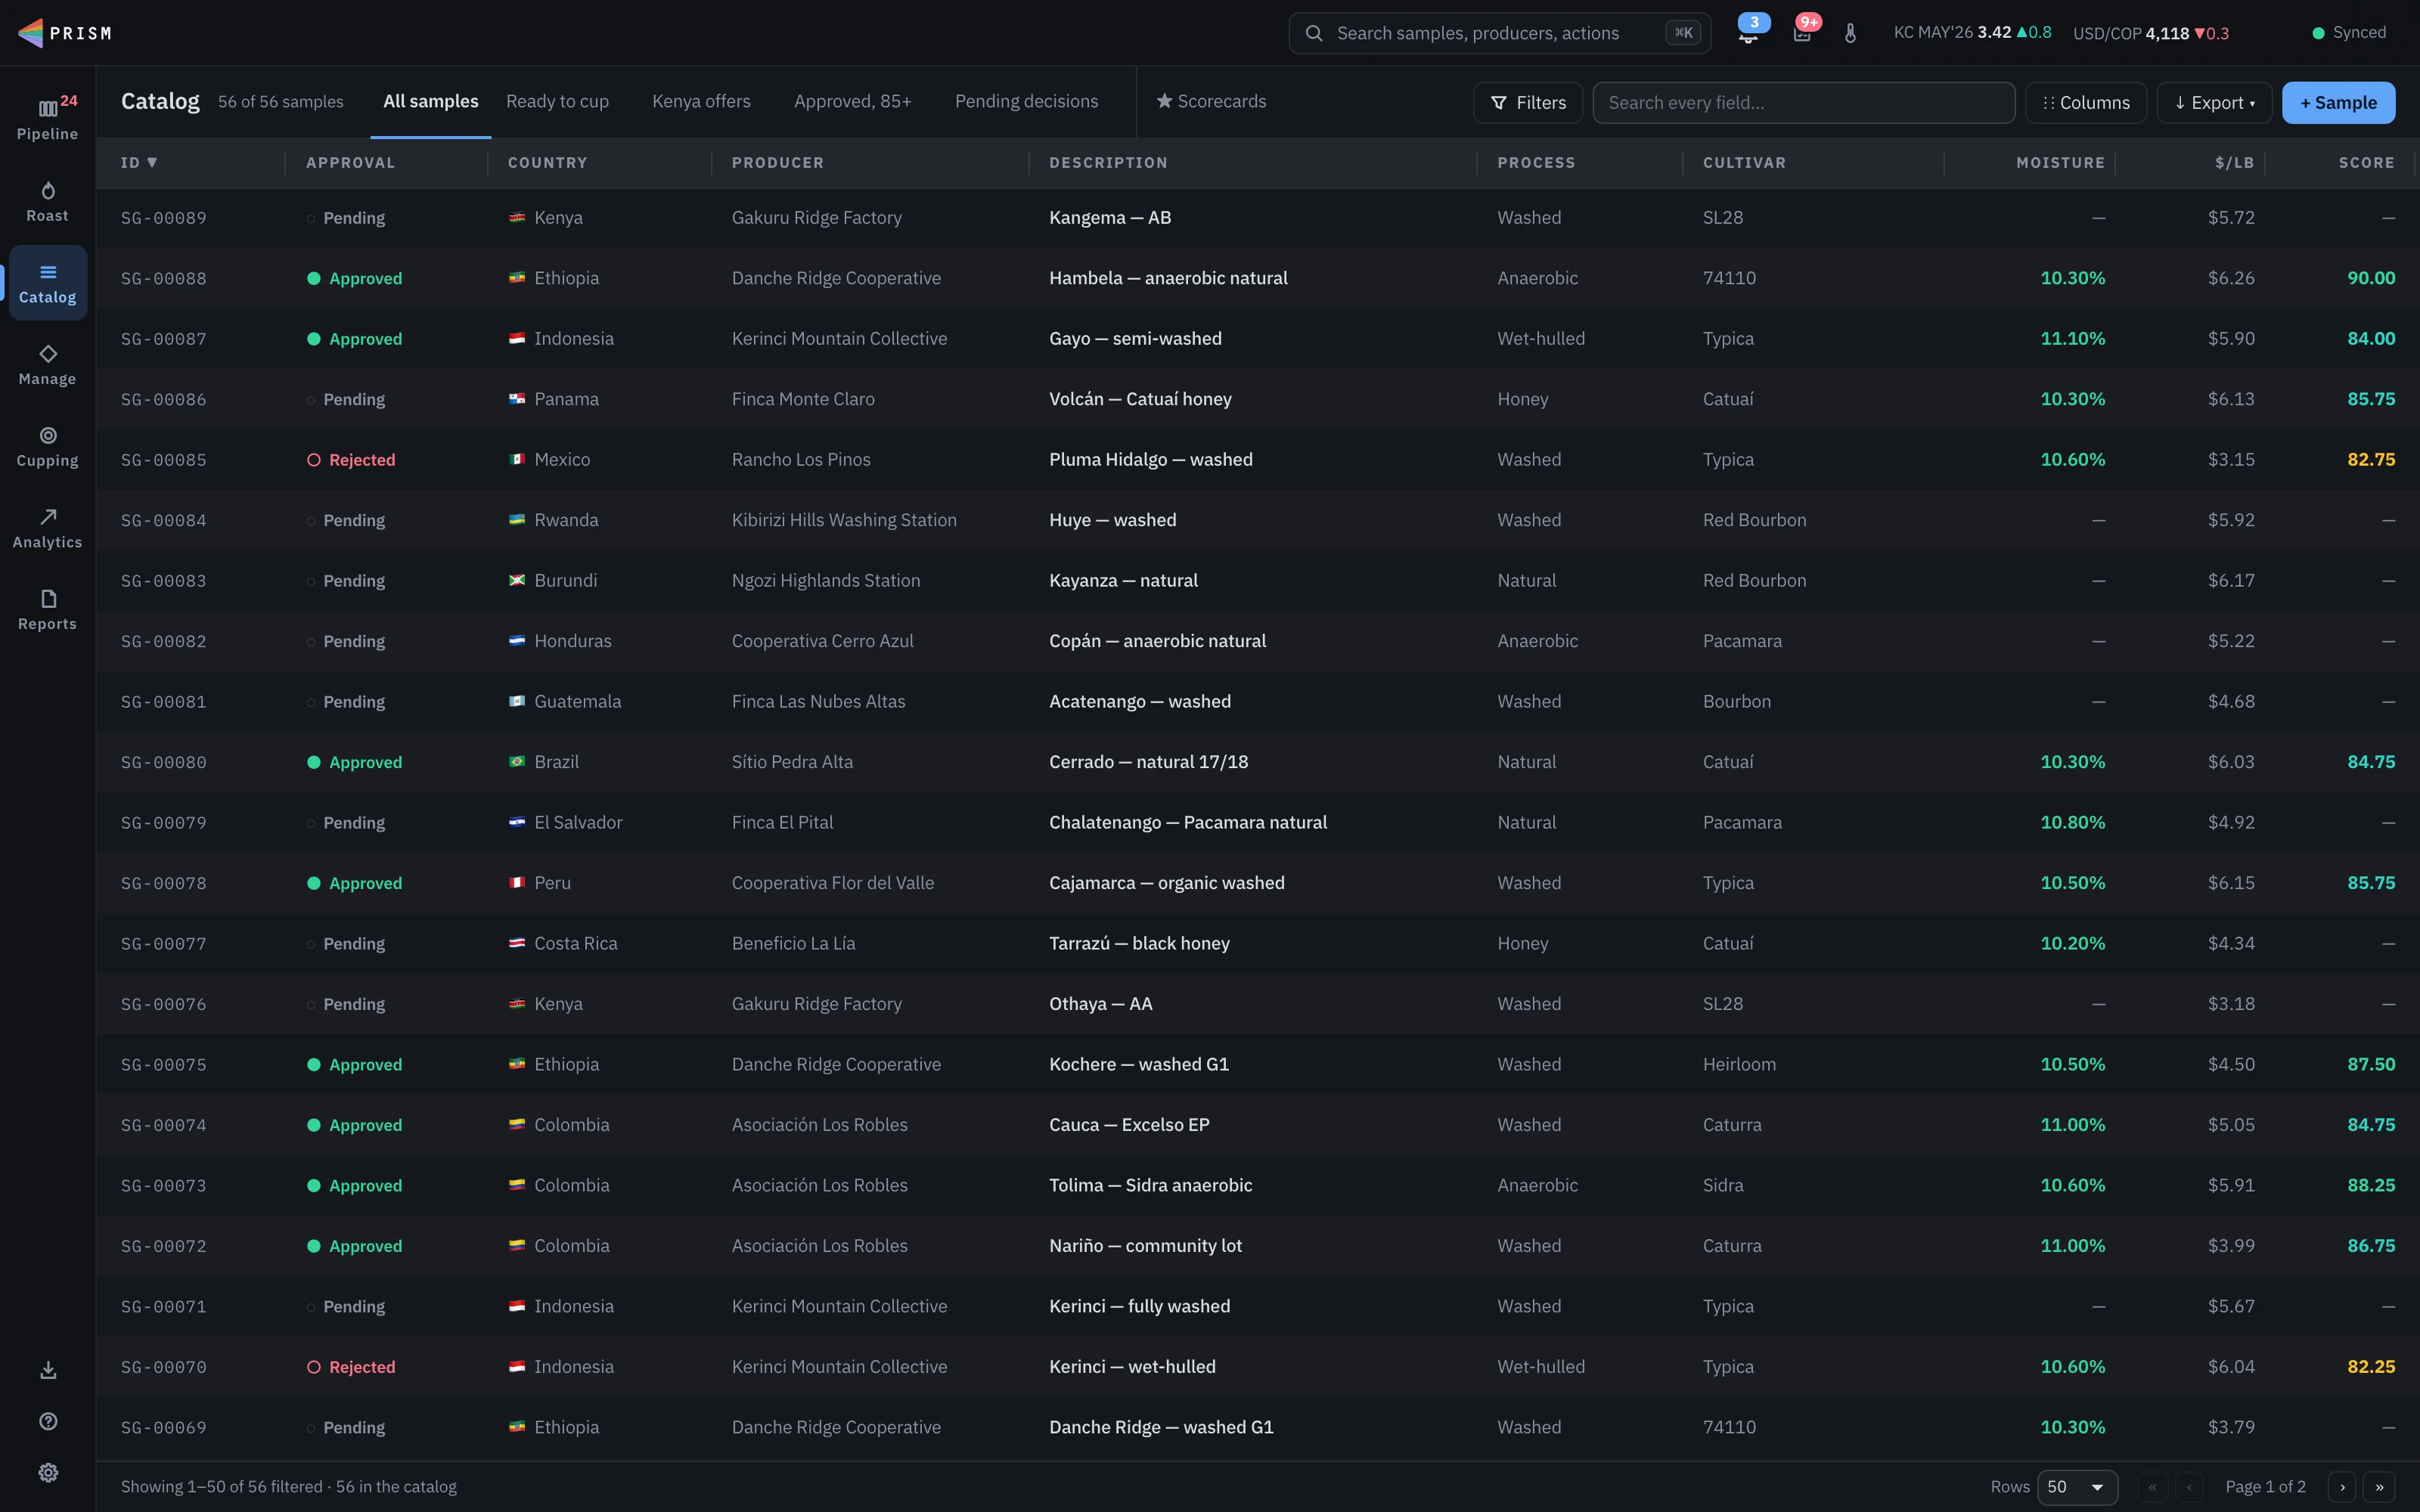
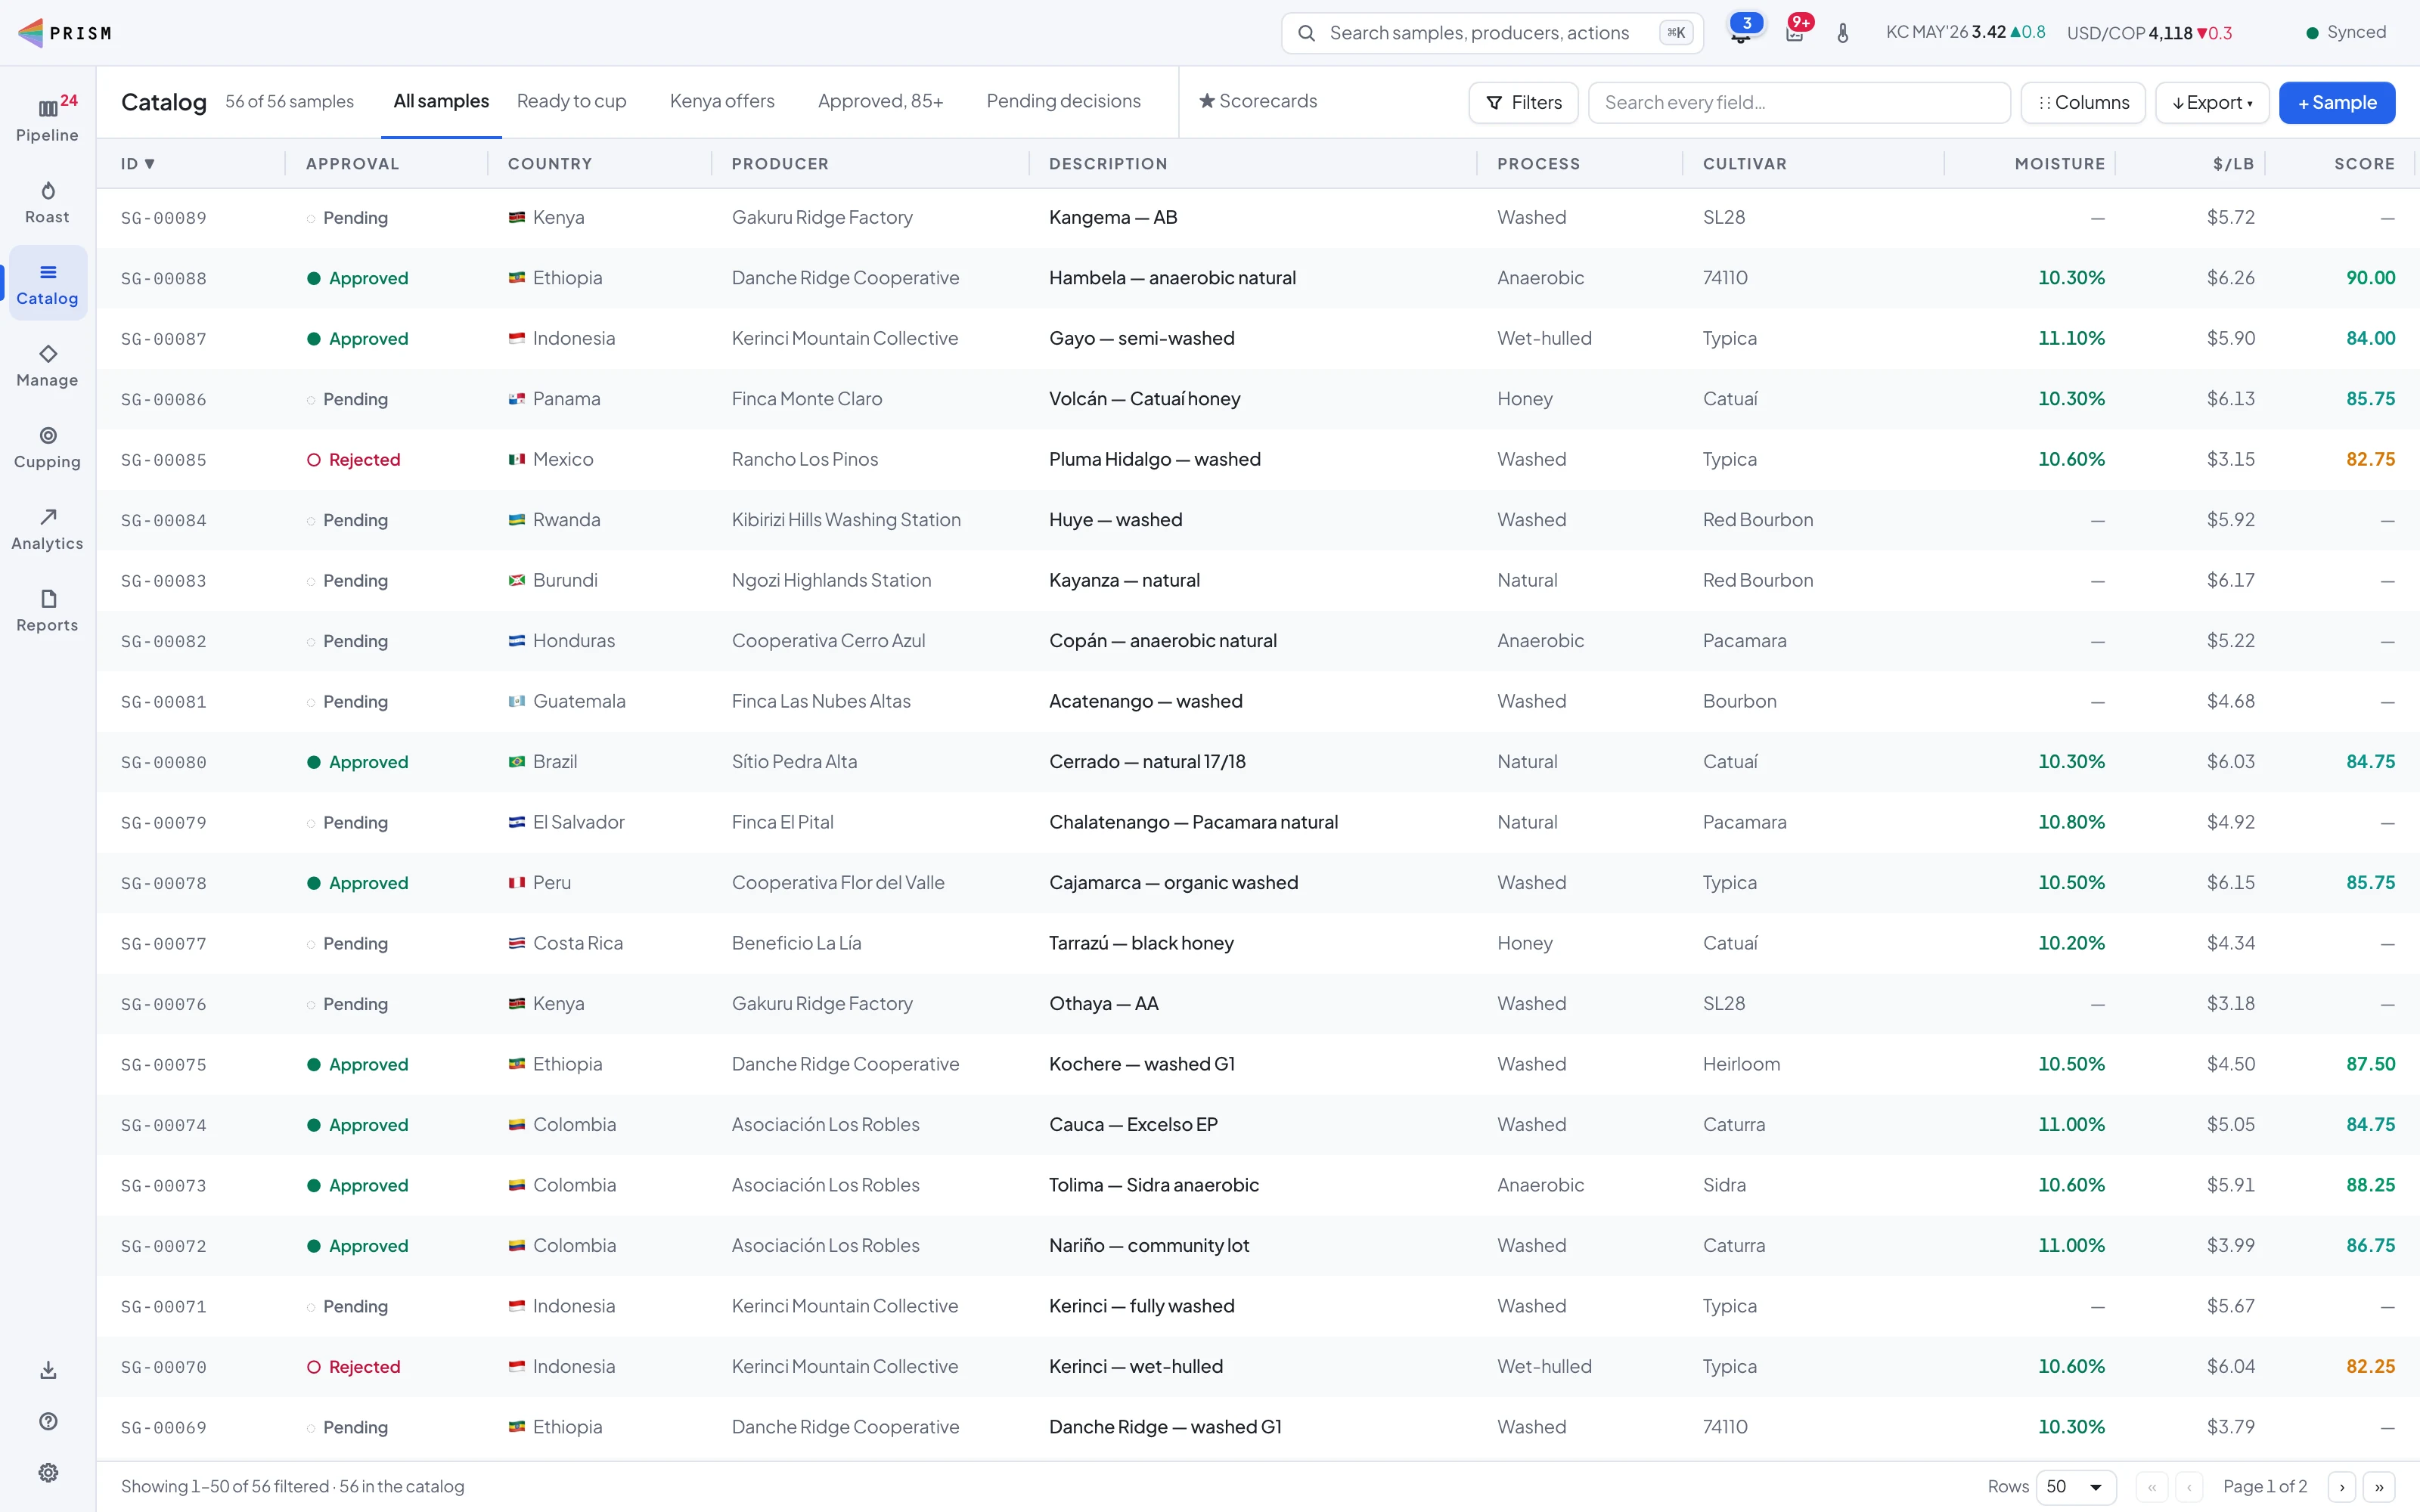
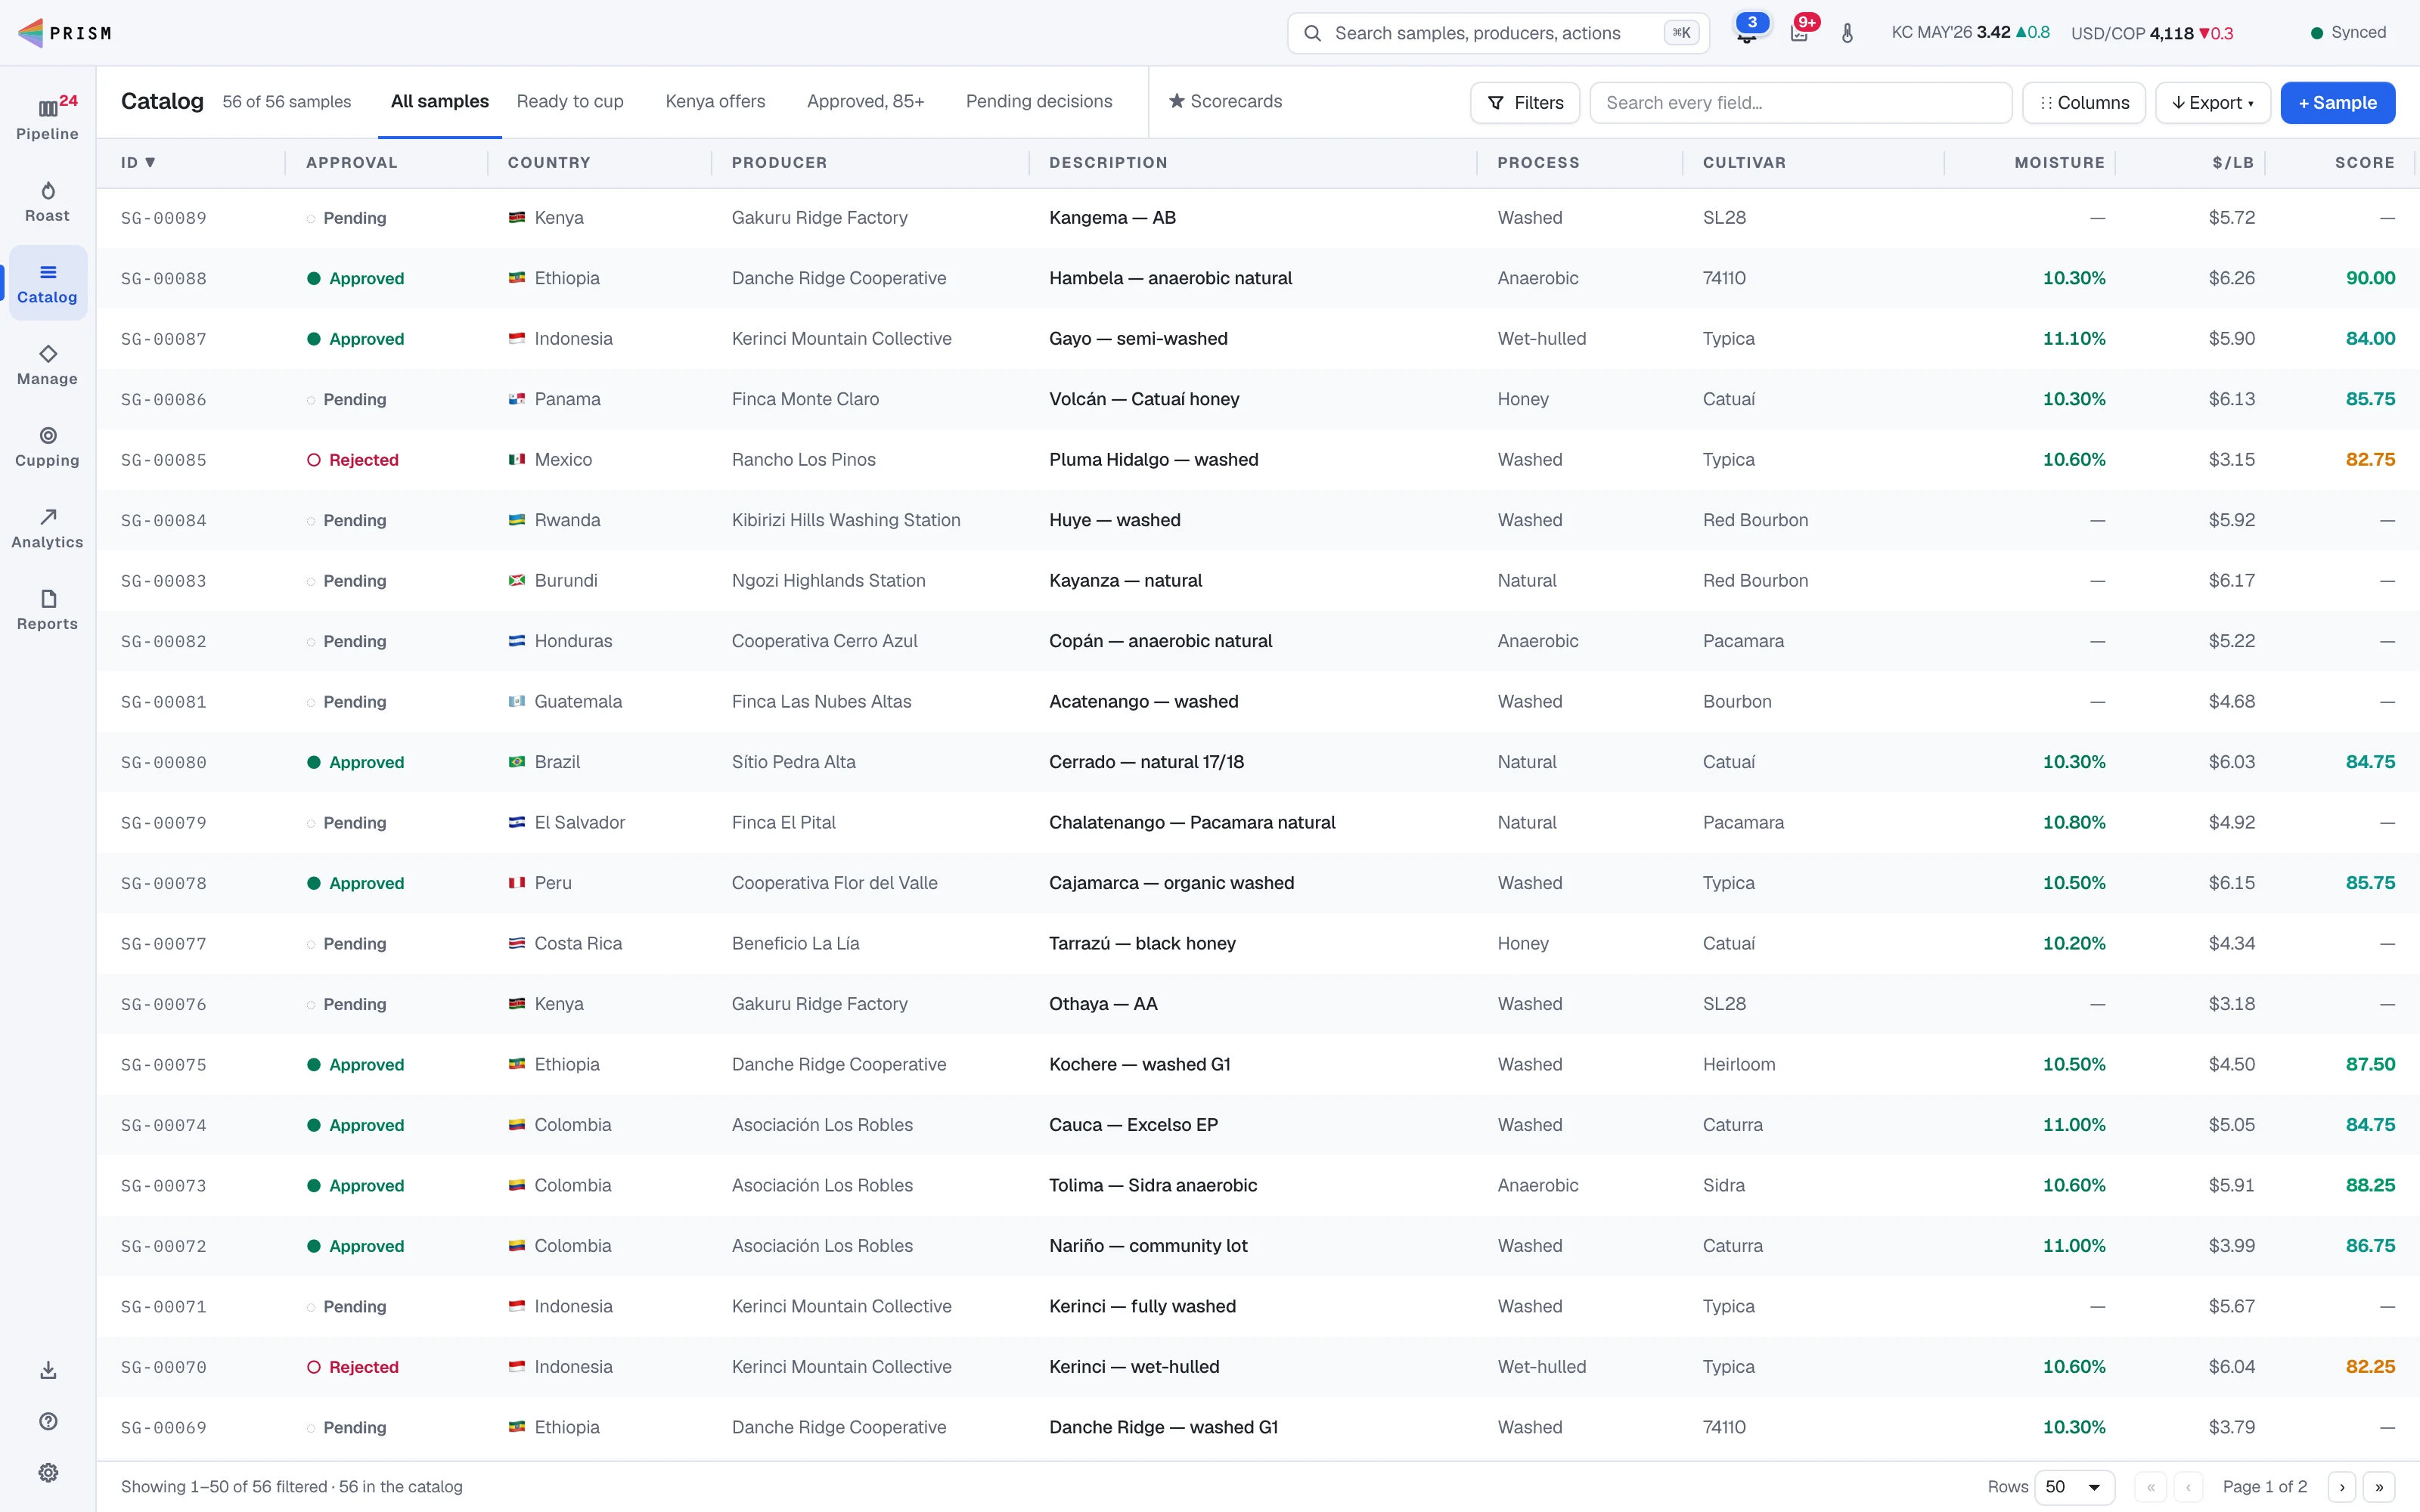
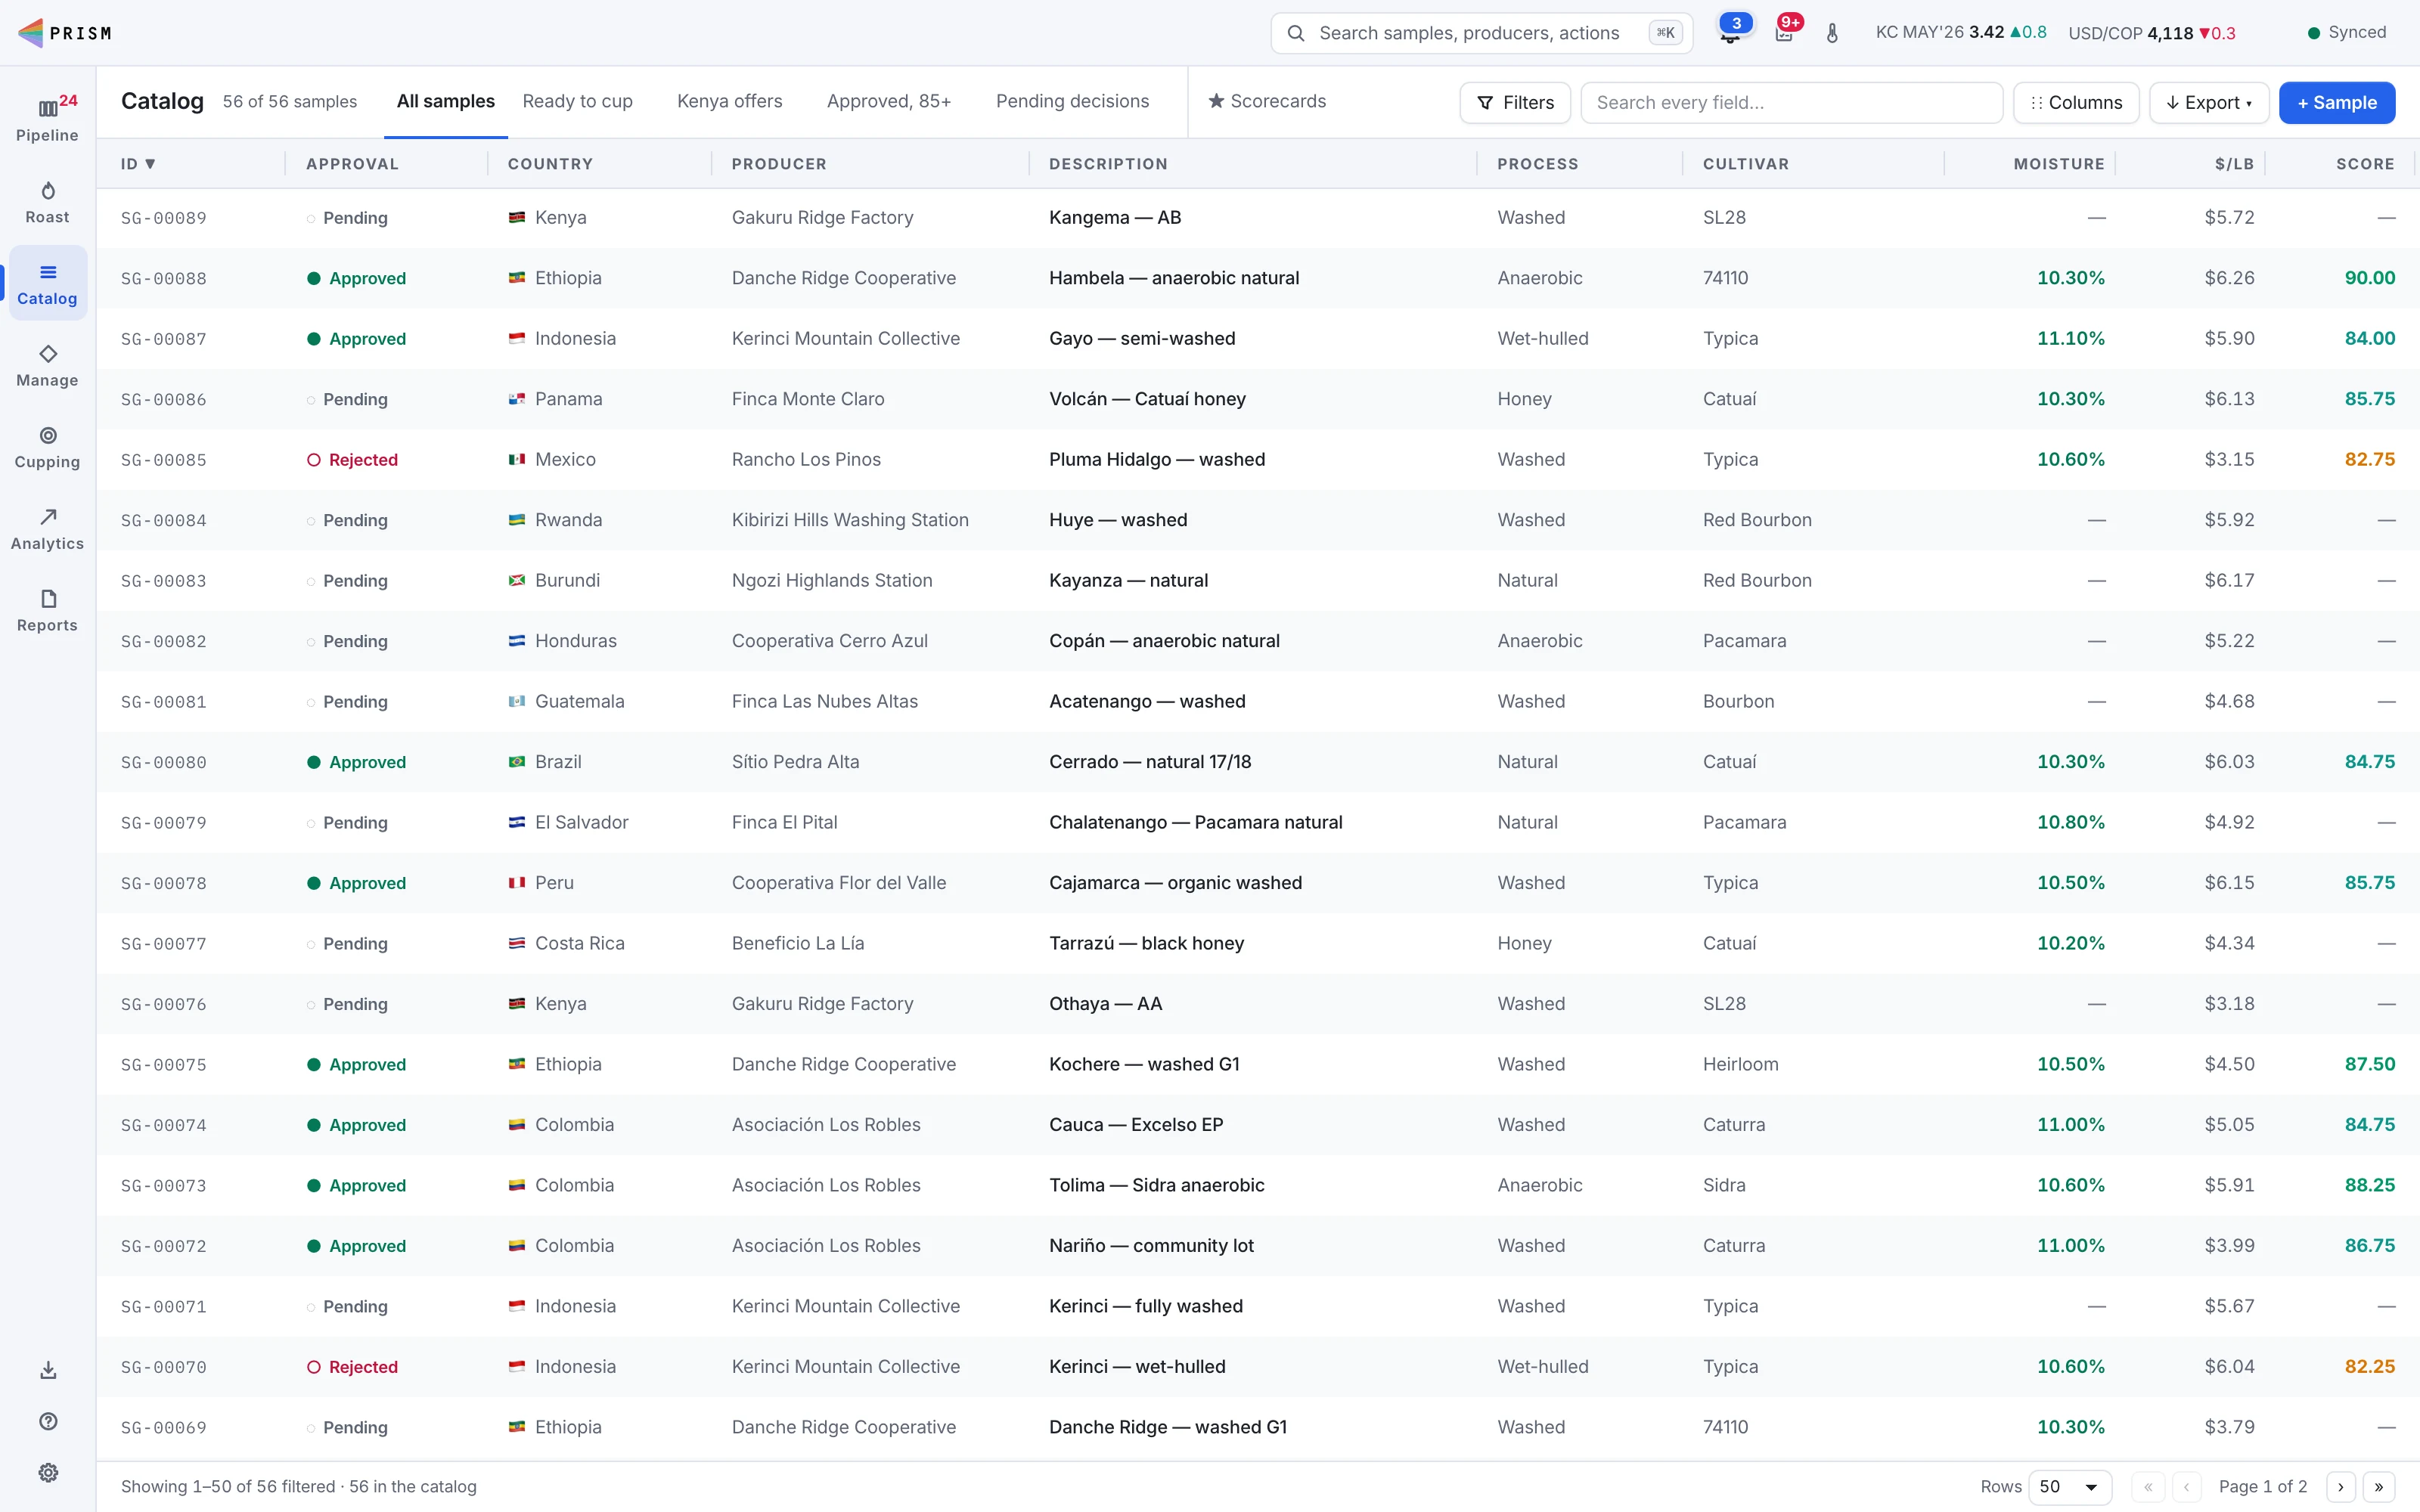
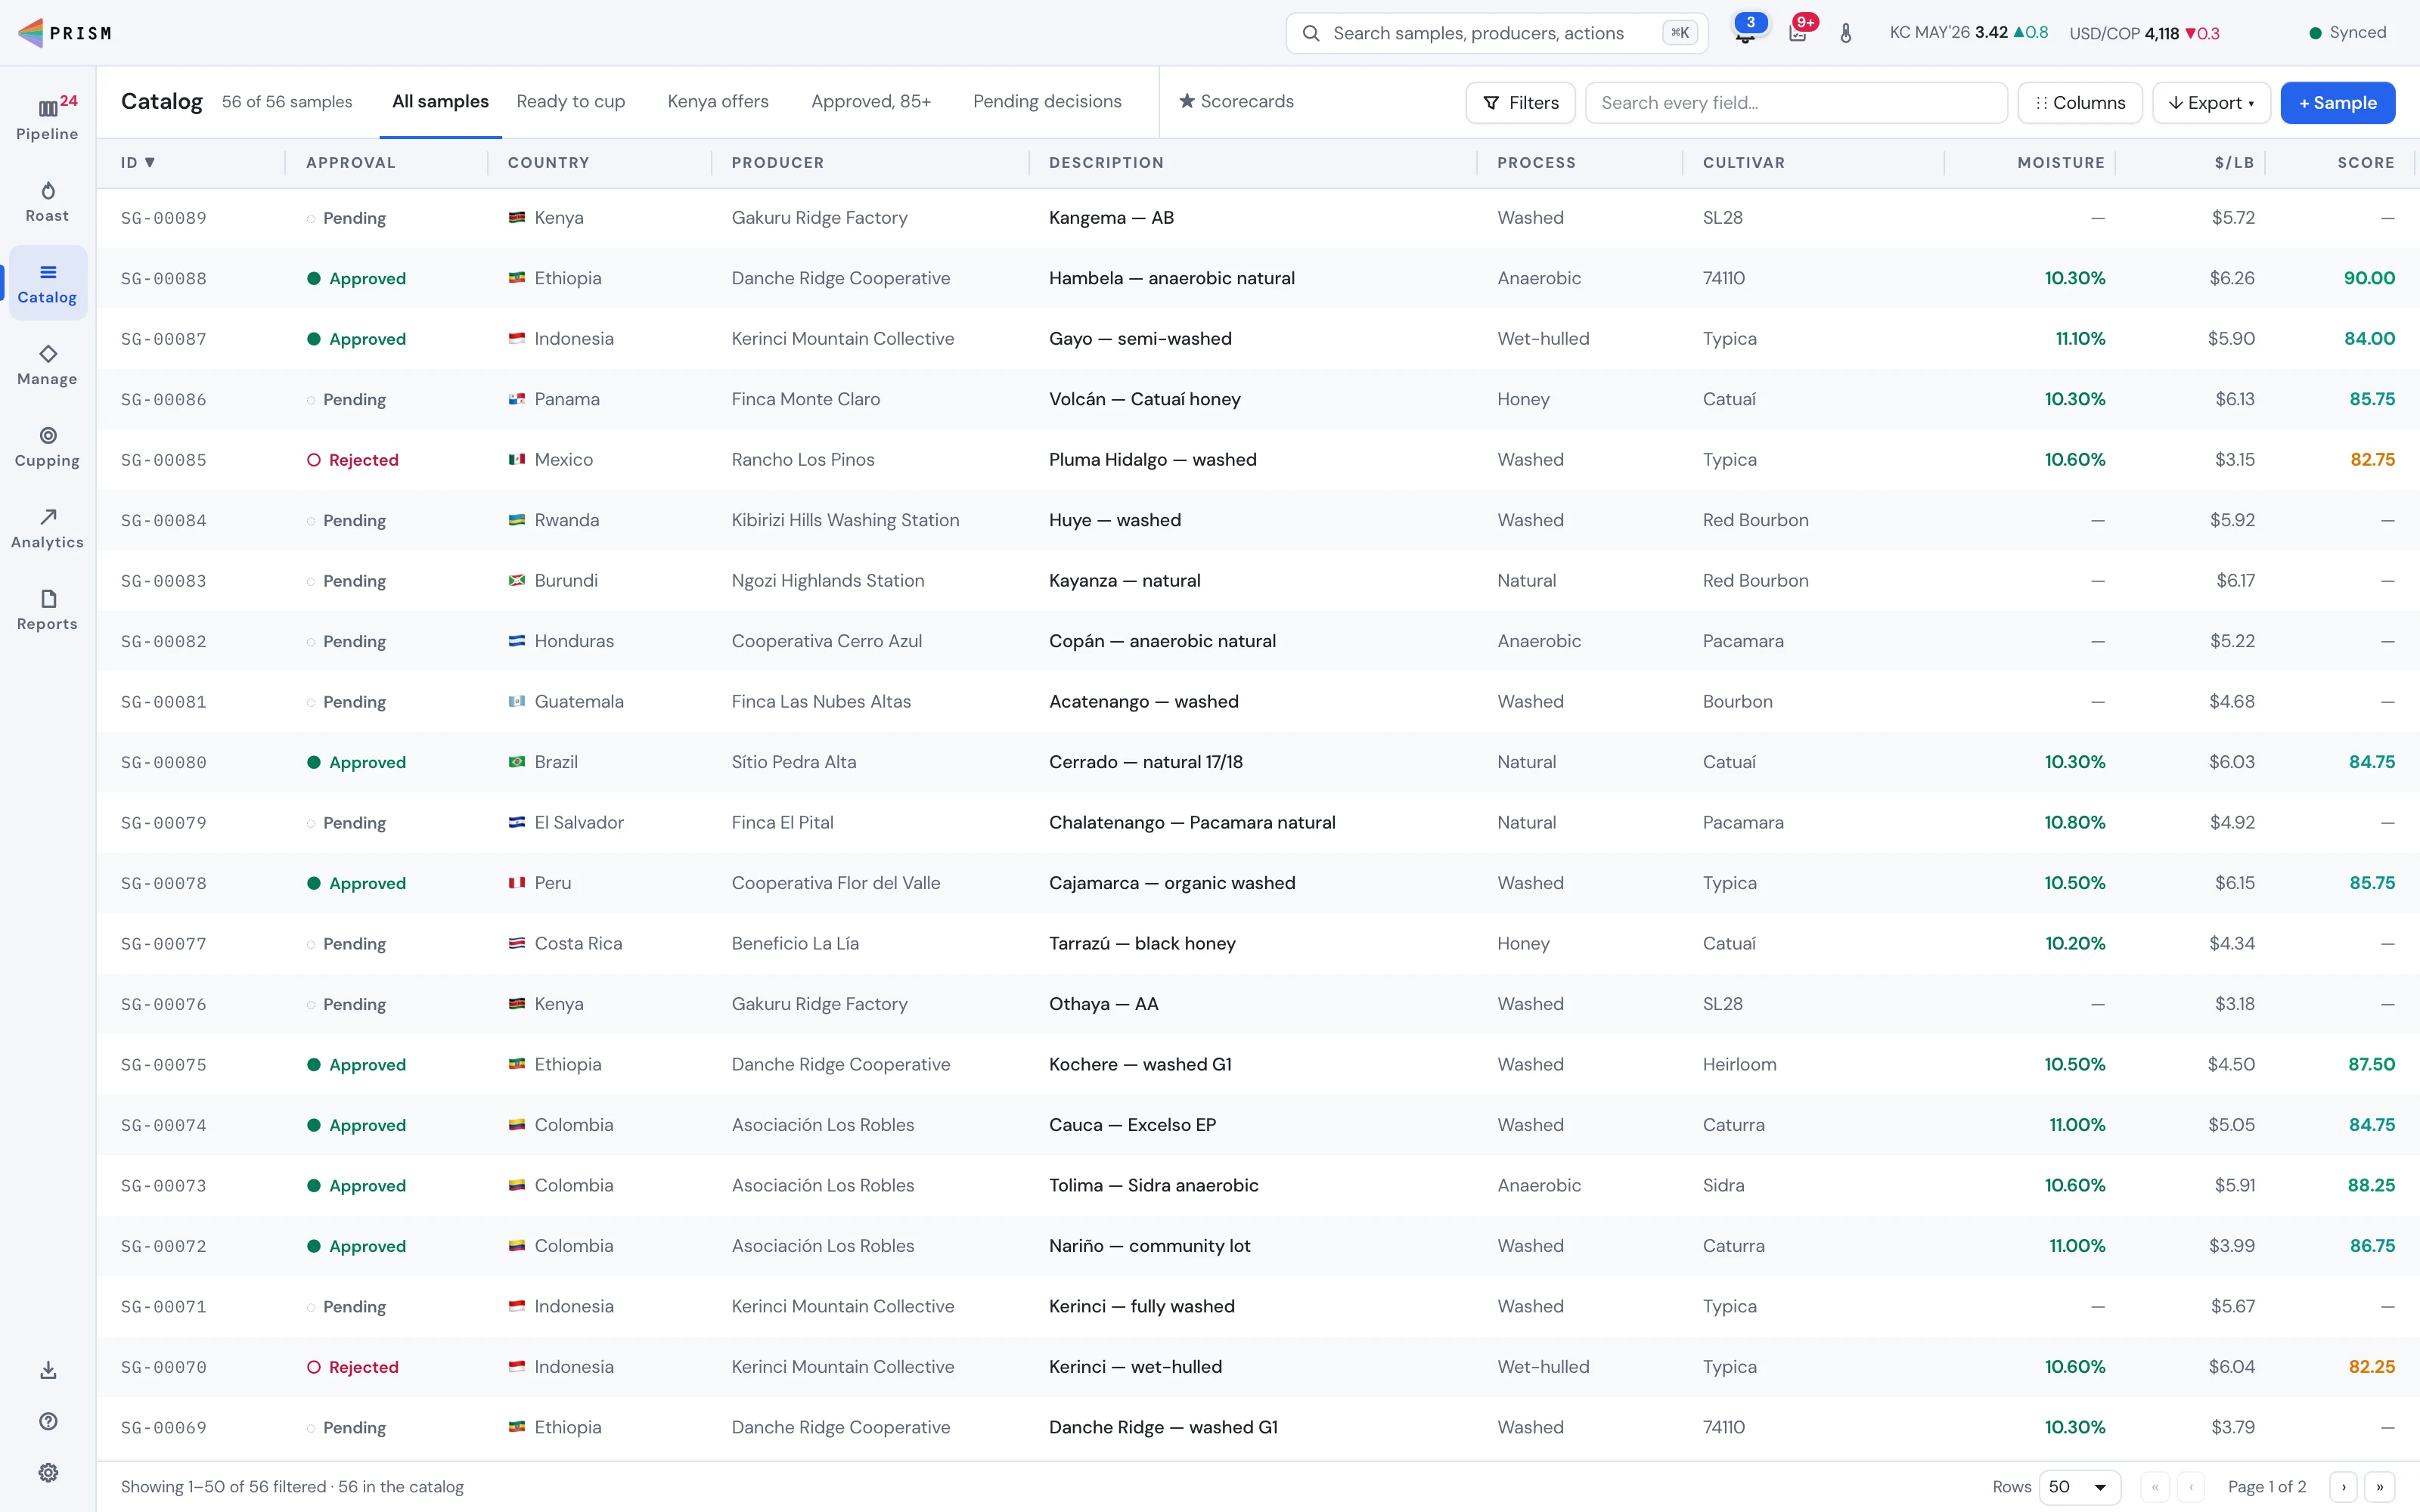
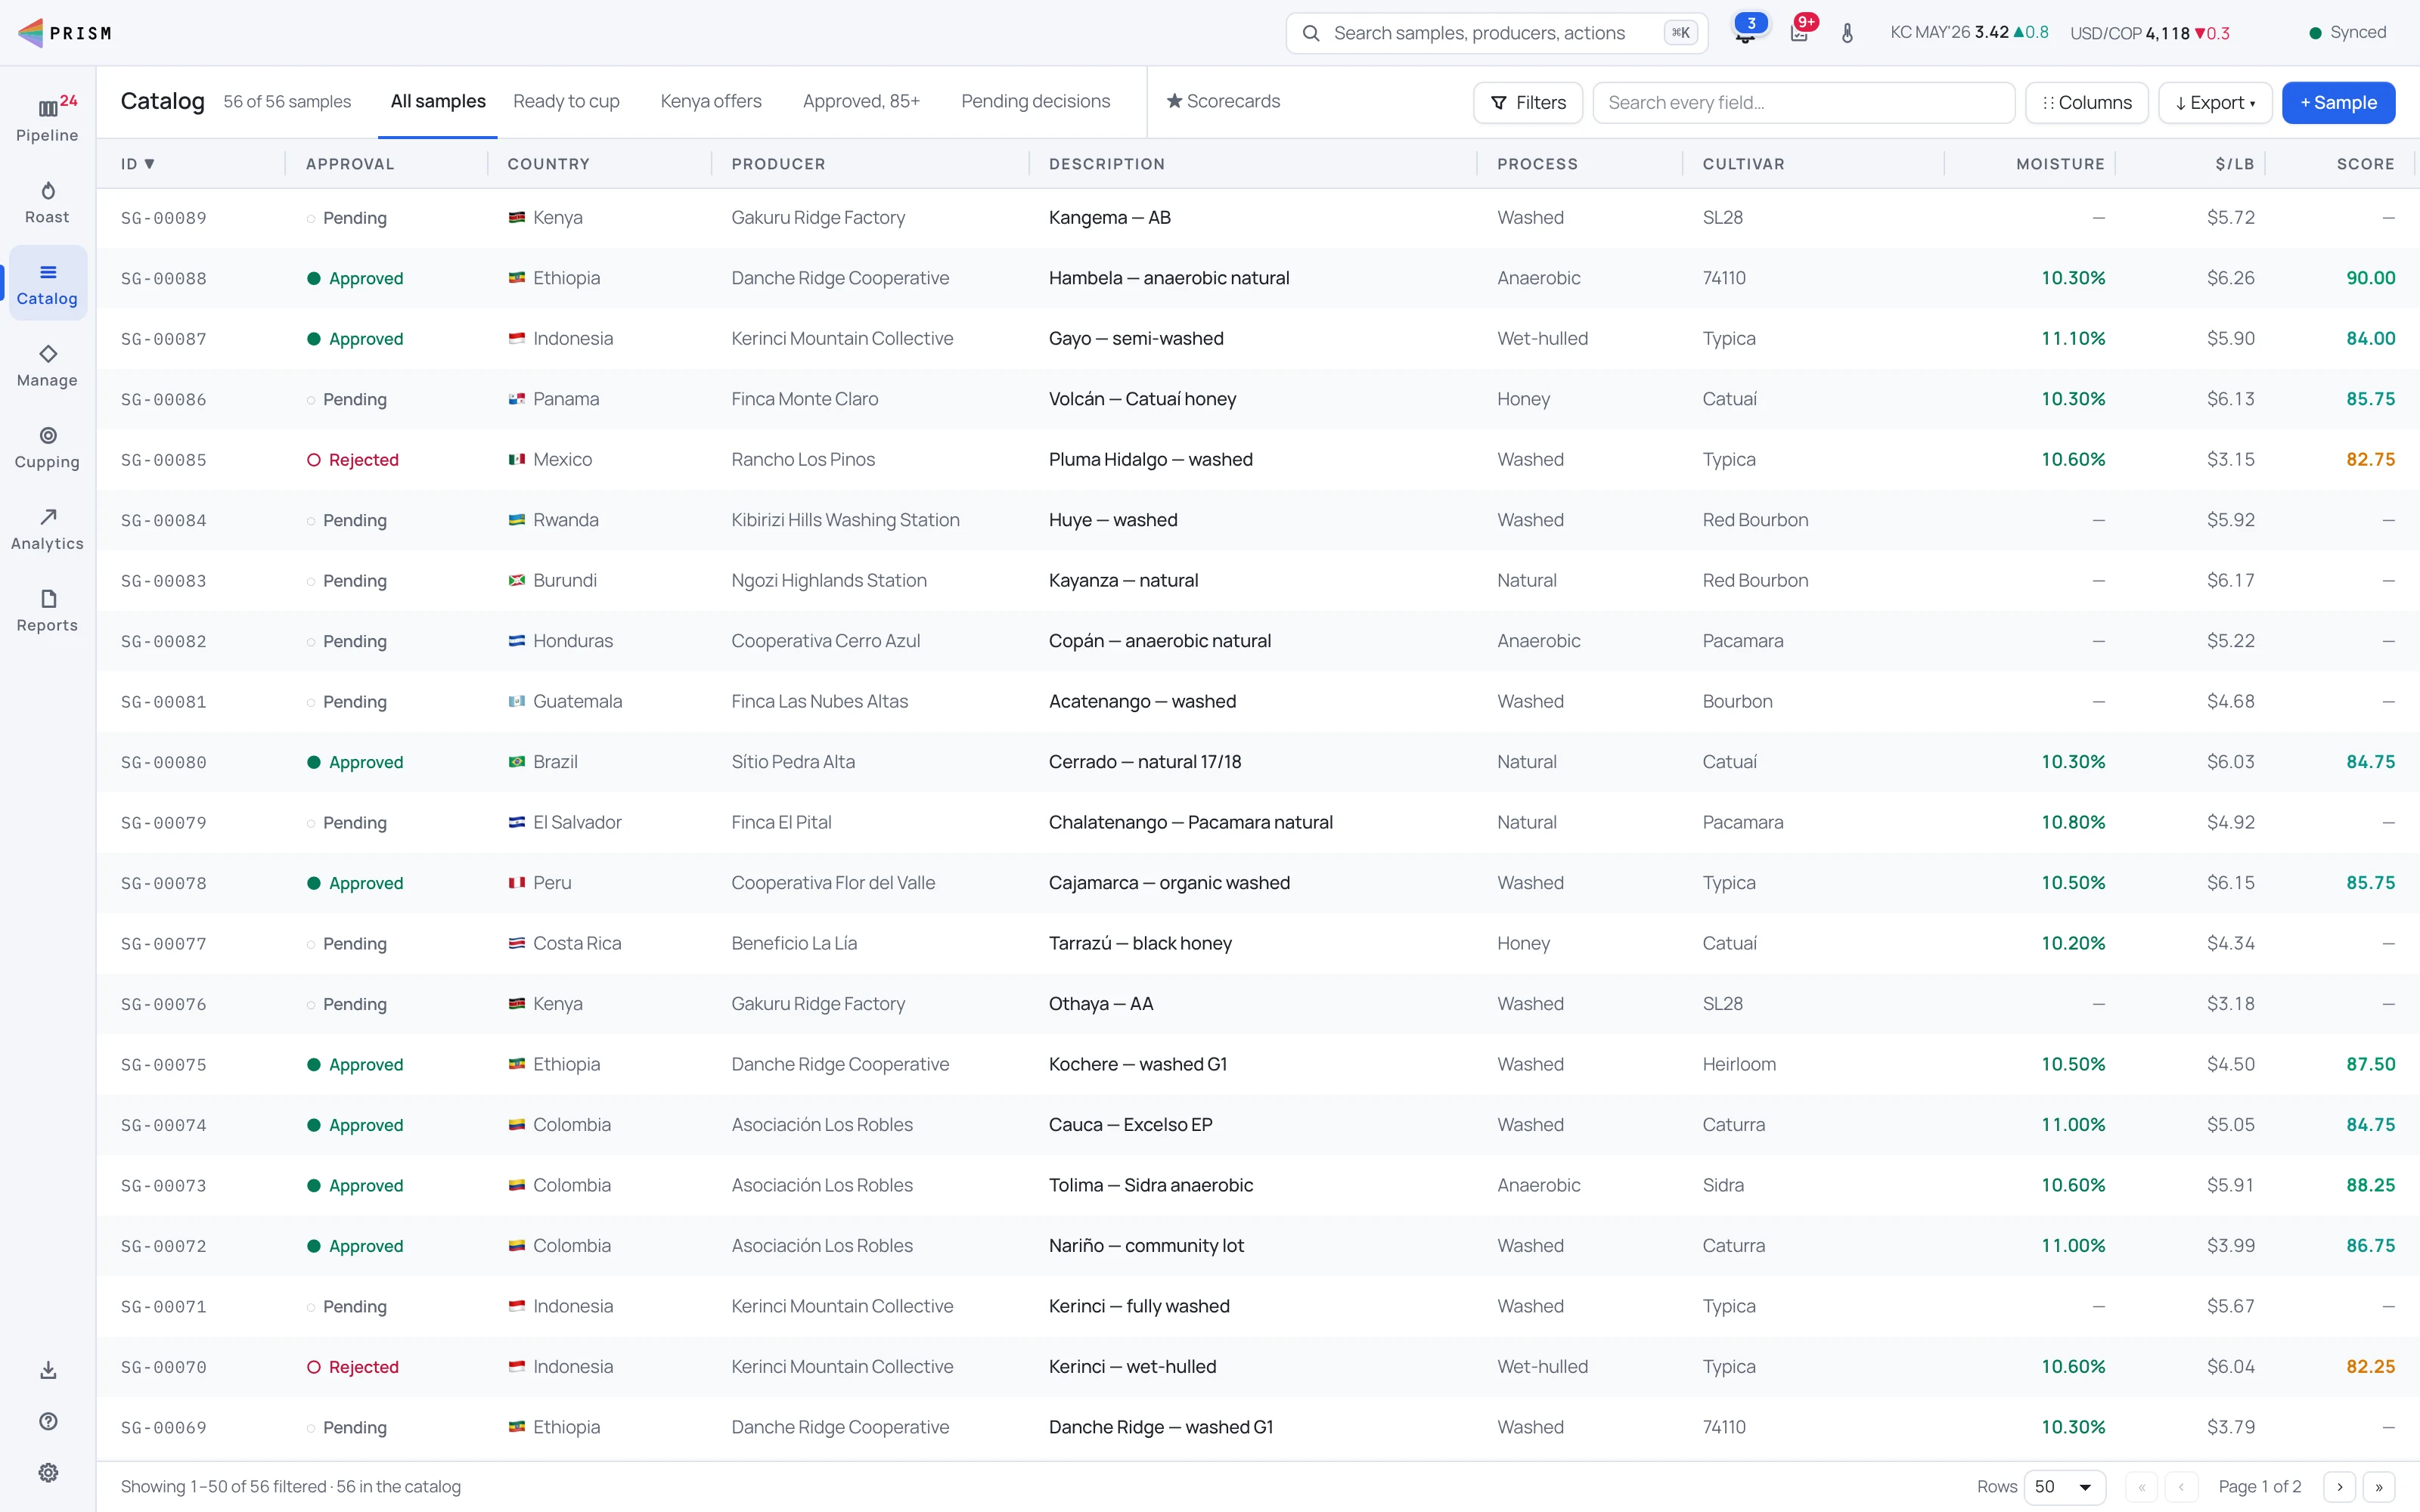
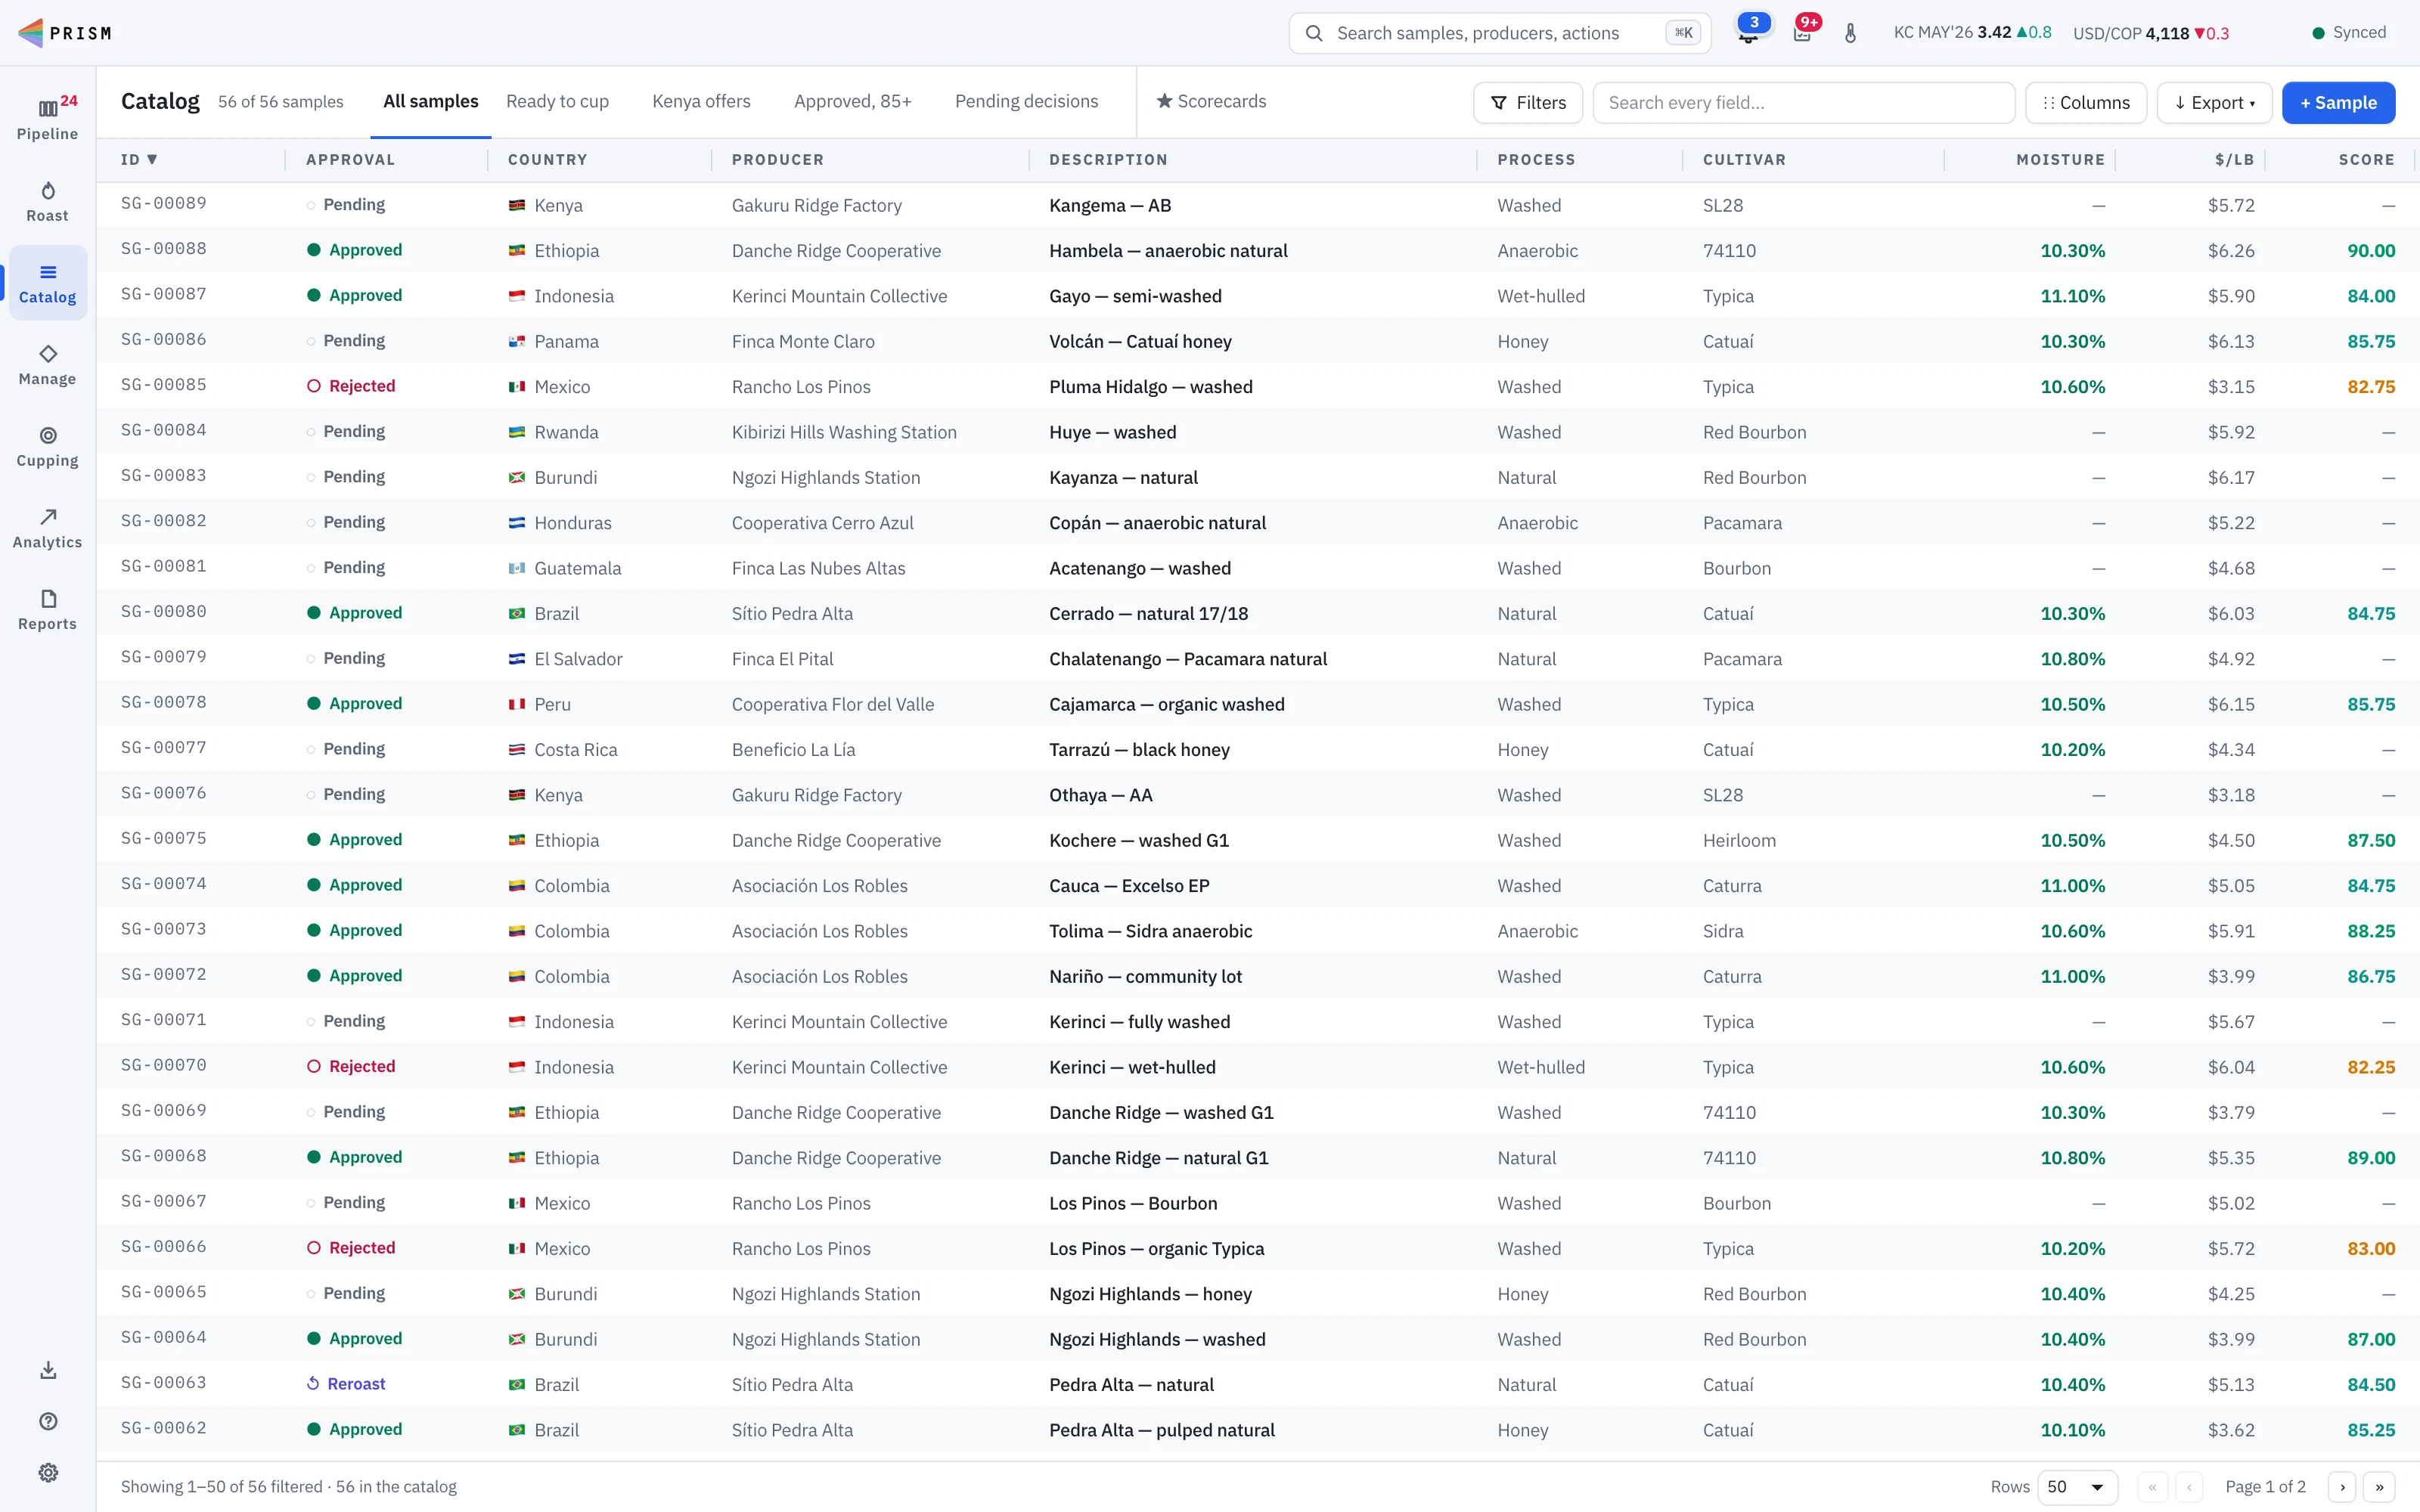
Numbers and reference IDs stay in IBM Plex Mono whatever the font, so columns line up, and PDFs always print in Plex.
Your rail, your order
An admin can drag the icon rail into the order your team works in, and the keyboard shortcuts follow it.
Dashboards you arrange
Move, resize and hide every analytics tile, and build your own panes.
Your units
°C or °F, kilograms or pounds, set once for the whole workspace.
Your name on everything
Your company name and logo on reports, share pages and emails, and your own methods statement on every report.
Platform
Built to be relied on
The details that matter when the room is busy, the network is flaky and the numbers have to be right.
Self-hosted
Runs on a standard PHP 8 and MySQL web host. Your records never leave your server.
Two-factor sign-in
Every account signs in with a password and an authenticator code.
Offline-first
Edits queue on the device and sync when the connection returns, with a sync light that tells the truth.
Team roles
Admin, read/write and read-only accounts, job-shaped permissions for exactly what each person does, and deleting allowed per person.
Traceable from farm to feedback
Every sample carries its farm, a printed label with its barcode, blind codes on the cupping table, and the result you send back to the supplier.
Data in, data out
CSV import for samples; CSV and JSON export of the full record; whole-workspace backups you can restore.
Phone, iPad, Mac and PC
An iPhone-style layout on a phone, drag-and-drop on an iPad, and Prism Desktop for Mac and Windows.
A year of updates included
Every license includes a year of updates, and Prism keeps working after that. There is no subscription to lapse.
See it working
Short tours
Why Prism
Built to close the gaps in green coffee
Developed by Christopher Feran of Hinterland Coffee Strategies.
Ready when you are
One license, your server, a year of updates, and no monthly fees.
One-time payment · no monthly fees · 1 year of updates · sales tax, if any, shown at checkout